Preventive and Predictive Methods for Torsional Vibration
It happens that we encounter inexplicable problems that we cannot interpret using conventional means and methods of vibration diagnostics. And it does not occur to all of us that increased vibration and equipment failures can be associated with torsional vibrations. What are they, what are dangerous and how are they detected, read in this article.
Abstract
While vibration analysis is widely regarded as one of the most effective tools for assessing machinery health, torsional vibration is often overlooked and misunderstood. The measurement of radial and axial vibration of the equipment shaft and/or casing typically does not provide insight into the angular vibrations, produced by torsion, in rotating or reciprocating shafts. Left undetected, torsional vibration can result in rapid failures of couplings, bearings, and shafts, creating the potential for significant health and safety hazards.
Preventive maintenance tasks can aid in detecting the presence of torsional vibrations by identifying fretting patterns, coupling flexible element deformation, and crack initiation points. However, these conditions occur later in the failure progression and do not yield enough information to properly identify the severity, frequency, or source of vibration.
Beginning with an understanding of the laws of motion, the torsional dynamics of any drivetrain can be analyzed during the equipment design stage to avoid the occurrence of adverse conditions. For equipment which is already installed, modern torque measurement systems can be utilized to verify theoretical models, evaluate changes to drivetrains components, or continuously monitor torque for effective defect identification. The integration of angular, radial, and axial vibrations can provide a comprehensive condition based monitoring system for critical assets susceptible to these failures modes in numerous industries.
Introduction
Torsional vibration describes the angular movement of a shaft(s) in a drivetrain, which is superimposed on the steady-state rotational movement of a rotating or reciprocating machine1 . More simply, torsional vibration refers to the angular or ‘twisting’ movement of the rotating shafts that connect the various pieces of equipment in a drivetrain. This form of vibration can be induced by the driving equipment, the driven equipment, or simply be the result of how the various inertias (rotating masses) and spring stiffness are distributed throughout the drivetrain. Drivers such as reciprocating engines and VFD-controlled motors; and driven equipment such as mills, large fans, reciprocating compressors, generators, and various turbomachinery can be susceptible to torsional vibration problems.
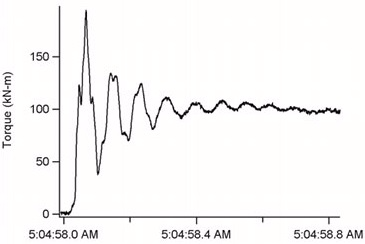
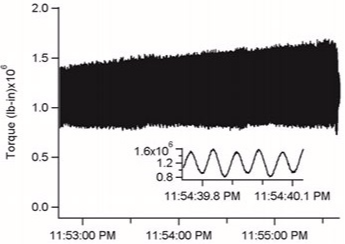
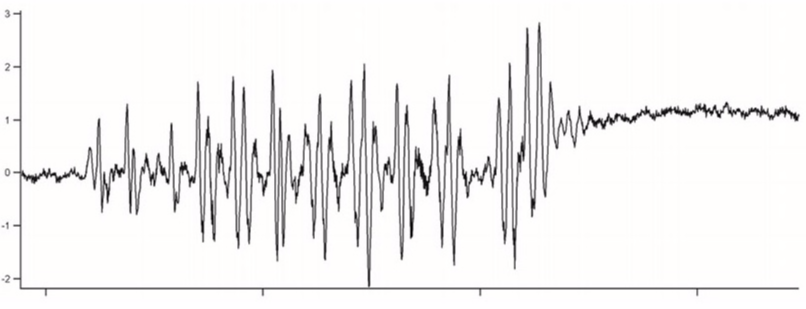
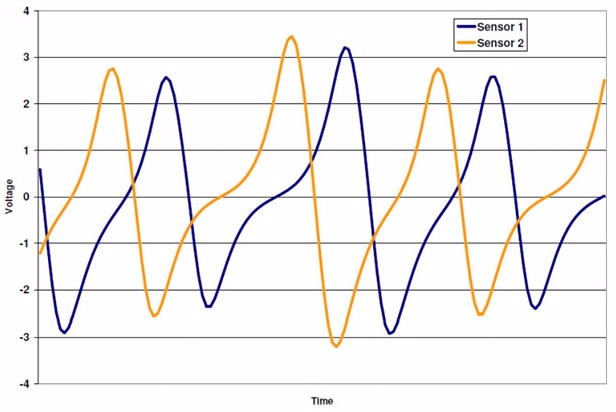
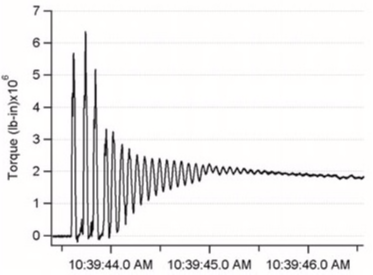
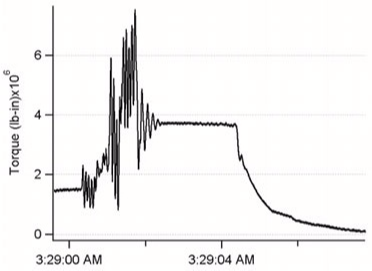
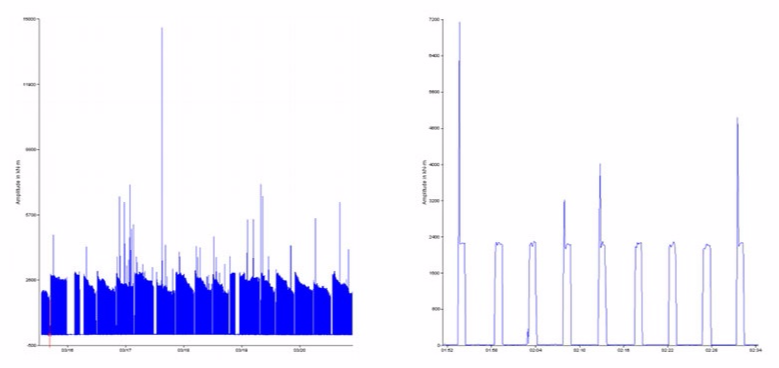
Depending on the source, torsional vibration can be present in different forms. Sudden impacting (an example shown in Figure 1) from intermittent loading, equipment start-up, or process upsets can produce vibrations that consist of a sharp peak followed by subsequent oscillations that eventually dampen out. Alternatively, torsional vibrations can be present in a more continuous nature as the result of constant process conditions, motor control fluctuations, or resonant conditions as shown in Figure 2.
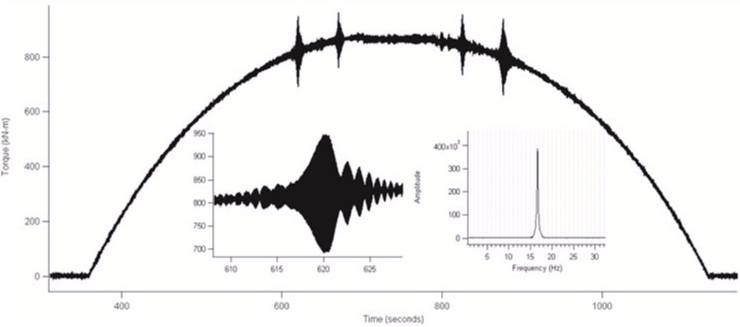
As with any type of vibration, a resonant condition will exist when an excitation frequency is in close proximity to a natural frequency. Generally, torsional resonance is more prevalent in higher-speed (> 600 RPM) applications. An example of torsional resonance during the start-up and coast-down of a motor driven centrifugal compressor train is shown in Figure 3. In this case the first torsional natural frequency was excited by the rotational speed, creating oscillating torques at a frequency of 16 Hz. These torque measurements can be used to identify potentially harmful operating conditions that need to be avoided.
Use of Torque Measurements
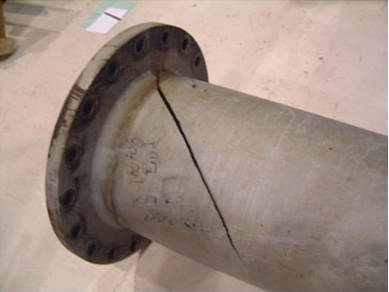
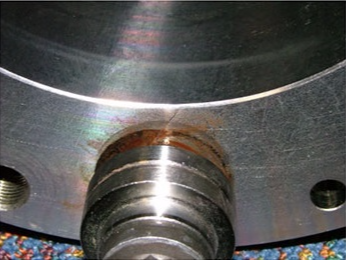
To make practical use of the measured torque, the value needs to be related to the mechanical stress which it induces in a drivetrain component. Torque can be damaging to equipment when it induces stresses in the load-transmitting material that exceed the endurance limit or yield limit. The endurance limit is the maximum stress that a material can be subjected to repeatedly without failing from fatigue. These values are typically much lower than the stress required to yield (permanent deformation) or fracture the material from a single applied load. Fatigue typically progresses in (3) stages: crack initiation, crack propagation, and final fracture. During the initial stages of fatigue crack propagation (Figure 4), no deformation of the material occurs so long as the stresses remain below the yield limit. This is the one of the primary reasons that torsional failures are difficult to detect. Later in the failure progression, or in cases of high amplitude loads, deformations (yielding) of a rotating shaft, flexible coupling, or gear teeth can typically be detected using traditional means of vibration analysis because they can cause the component to rotate eccentrically, producing a mass imbalance (Figure 5). It should be noted that material yielding can occur once a fatigue crack has grown and the component is no longer capable of transmitting the nominal load even if they are below the material yield limit. Also cracks and fractures which occur at a 45-degree angle on a shaft are typical in torque related failures.
One relatively simple method for determining acceptable stress levels from alternating loads is the Modified Goodman Diagram. This method plots the value of mean stress on the horizontal axis and the value of alternating stress on the vertical axis. A combination of mean and alternating stresses in the region below the ‘yield line’ and ‘modified Goodman line’ (shaded gray in the figure) indicates an infinite fatigue life. Stresses outside of this region indicate finite life. The values plotted in Figure 6 were calculated to understand the effect of alternating loads on the fatigue life for gear teeth, specifically bending fatigue in the tooth root. The mean stress was considered to be the stress from the nominal driving torque (based on nameplate power and speed). As torque measurements were not available, hypothetical values of alternating torque where then added, based on an increasing percentage of the nominal torque. The analysis showed that mean stresses of 4 to 5 times the nominal values combined with cyclic loads could create would create a finite life situation. While gear tooth stresses are relatively simple to calculate, other methods such as finite element analysis are better suited for more complex geometries.
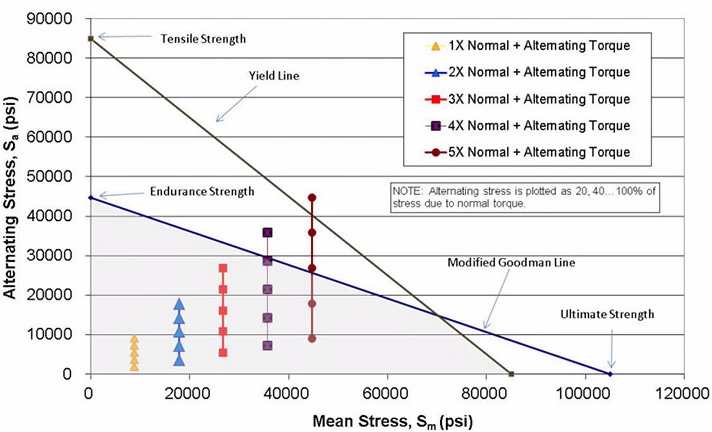
In the example used for Figure 6, the endurance limit was calculated as a percentage of the ultimate tensile strength (typically 42.5% of the ultimate strength for this particular material). Other factors which might further decrease the endurance limit should be considered when determining safe limits; including: surface condition, operating temperature, size, load, and criticality. Testing of a material specimen is the most accurate way to determine the endurance limit, and should be performed for critical components and those which are design to shear at a prescribed level in the event of an overload (shear pins, shear grooves, etc.)
A limitation of the Modified Goodman approach is that it assumes the alternating stresses occur at consistent amplitude. In most cases the amplitude of the torsional vibration (and hence alternating stress) will vary. Additionally, reversing torques as shown in Figure 7, are better analyzed with other methods. The Palmgren-Miner rule is one method for determining fatigue life in cases of variable amplitude loading.
Preventive Methods
The amplitude of torsional vibration can be destructive and since most machinery is not equipped to measure it, the first indication of a problem is typically failure of a drivetrain component1 . However, there are some methods for detection that can be utilized to determine the presence of torsional vibrations. Flexible shaft couplings often times provide tell-tale signs that can be detected visually upon disassembly or, in some cases, during operation. The flexible element(s) of the coupling (i.e. disc pack, gear teeth, grid, elastomeric blocks, etc.) which are meant to accommodate for shaft misalignment while transmitting the load are the components of the coupling that are primarily susceptible to damage which is visible. Additionally, shaft sections, keyways, and bolted flange connections can present visible damage; but this usually occurs in addition to flexible element damage due to the higher torque capacities of those interfaces and components.
For drivetrains which include a gearbox, audible noises may be detected when torsional vibrations are present. This can sound like ‘chattering” or looseness in the gear mesh. However, without a more detailed inspection, or actual measurements, the loads seen during these events cannot be determined. Note that radial vibration is sometimes measureable on gearboxes when torsional vibration is severe.
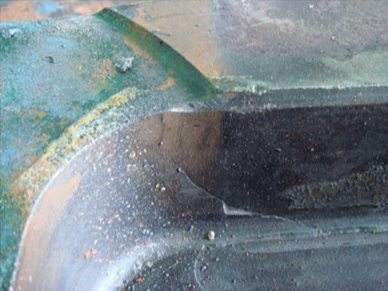
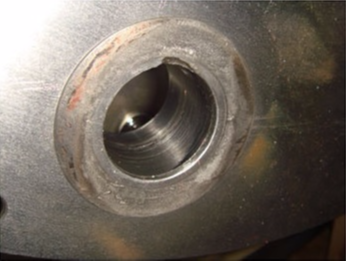
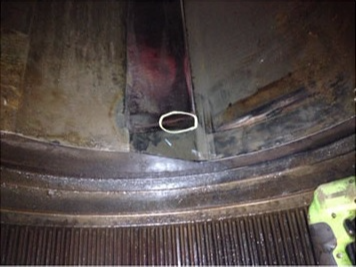
Fretting is the result of the relative movement of two surfaces subjected to a load. Torsional vibration can produce fretting wear in bolted flange connections, splines, and at hub/shaft interfaces. During inspection, couplings and shafts should be carefully inspected for signs of fretting as it tends to reduce the fatigue life and is a common crack initiation point. For ferrous materials, surfaces with fretting wear usually contain reddish-brown areas which are oxidized wear particles as well as some areas that appear polished as the wear particles begin to serve as a lapping compound. Figure 8 shows a fretting wear pattern around a bolt hole of a coupling flange connection caused by relative movement of the flange and washer. Figure 9 shows a different bolt hole with a crack that has begun to propagate and after initiation in the fretting zone.
Visual inspection should also be aimed at finding surface cracks in the load-carrying components. Attention should be paid to areas where the stress can become concentrated by sharp corners or an abrupt change in geometry such as steps in a shaft, keyways, welded joints, etc. The limitation of visual inspection is that small and sub-surface cracks are not visible to the naked eye. For critical equipment susceptible to torsional vibration, inspection methods for crack detection should include either dye penetrant or magnetic particle inspection (MPI). Dye penetrants are effective at quickly identifying surface cracks, but are not capable of detecting sub-surface cracks and can be difficult to use in small corners. MPI is typically the best method to detect cracks in ferrous materials. Examples of cracks detected using MPI in the root of gear teeth and a coupling component are shown in Figures 10 and 11, respectively.


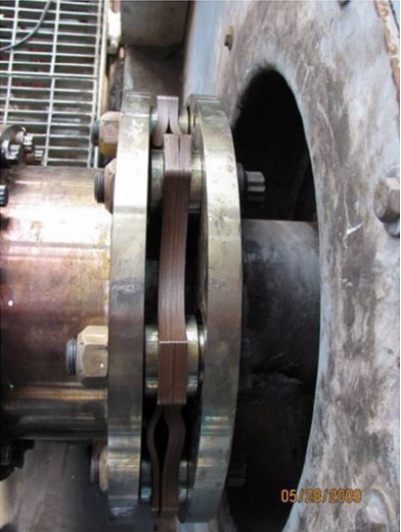
With some type of couplings whose flexible element is visible while in operation, non-intrusive inspection methods may be possible. The use of strobe lights during operation can help identify abnormal deflections of the flexible elements. As an example, Figures 12 and 13 show a flexible disc pack in operation. Torsional vibration can cause the individual discs to separate and buckle. Coupling manufacturers can provide guidelines for acceptable limits of disc spreading. Note that shaft misalignment and installation errors can also create this occurrence. Torque-related problems typically cause buckling to occur at every other link between bolted connections. This is because the disc packs are alternately bolted to the driving and driven side of the coupling.

Elastomeric couplings are often installed to increase system damping, and hence reduce or restrict torsional vibration. These couplings utilize rubber in compression or rubber in shear as the flexible elements. Compressed rubber will tend to absorb the torsional vibration energy in the blocks where it is converted to heat. Excessive vibrations will melt the rubber material from the inside of the blocks which won’t be visible until complete failure occurs or if the blocks are sectioned for inspection when they are replaced. Rubber in shear couplings will often show signs of degradation at the interface between the rubber and metallic material which can be visually inspected.
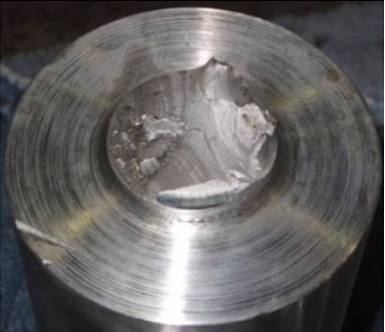
In the event that failure does occur, the fracture surface should be inspected as it can help distinguish between different potential failure sources – a one-time overload from a process upset, or torsional vibrations which are inherent to the drivetrain design or operation, requiring more extensive corrective actions.
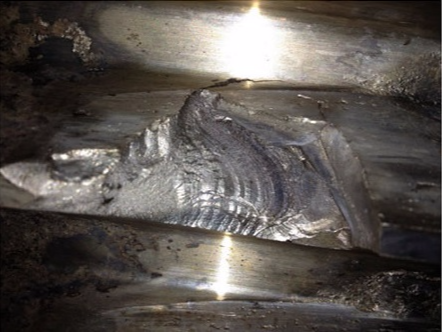
A metallurgical analysis performed by a competent test laboratory will provide the most comprehensive results, but it can be time-consuming and doesn’t typically provide insight into potential design or operational modifications necessary to correct the problem. One key piece of information that can be gained from the fracture surface is the crack initiation point. Simply knowing where the crack started can determine if design changes should be considered, which might be as simple as increasing a radius, shot-peeing the surface for fatigue resistance, or recognizing the need for improved manufacturing and quality processes. Most fracture surfaces from fatigue failures will exhibit beach-marks (striations), which 8 of 19 resemble the tidemarks on a beach. The beach-marks expand outward from the crack initiation point in a circular or semi-circular pattern and are followed by a region of fast fracture. Multiple initiation points can be present and are usually evidenced by what are called ratchet marks, which occur when separate patterns of beach-marks intersect.
Fatigue is sometimes used synonymously with age-related failure or equipment wear-out. There is a component of time, in relation to the cycles of vibration, but this can be matter of seconds in some cases. Fatigue failures are typically characterized as either low-cycle (<1,000 cycles) or high-cycle (>1,000 cycles). Theoretically, if a drivetrain is operating at 1,800 RPM and the speed coincides with a natural frequency that is synchronous with speed, short cycle fatigue failure could occur within 30 seconds, provided the stresses induced are above the material endurance limit.
Failures due to periodic impact loading can resemble those due to torsional oscillations. The impact represents one or several cycles of vibration which typically occur during start-up, shut-down, speed changes, or are a result of the mechanics of the process. Again, the magnitude of the stresses and frequency in which they occur will determine the fatigue life.
Torsional Dynamics
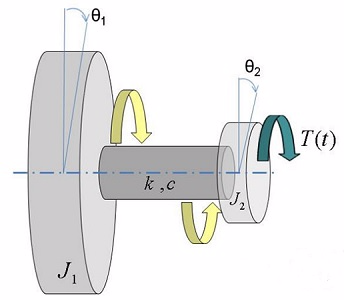
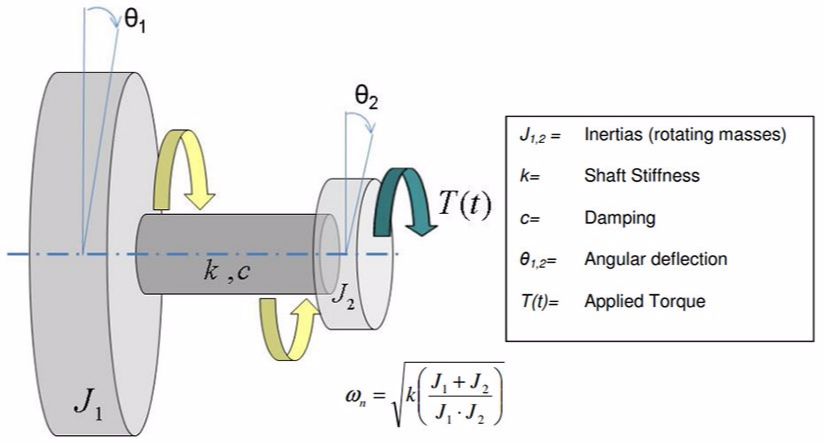
As with any form of vibration, the oscillatory movement of an object is governed by the universal laws of motion and is usually described in terms of a mass-damper-spring system. Analogous with mass in linear vibration, inertia describes a rotating mass in a torsional reference frame. In a drivetrain, examples of inertia include the motor rotors, gearing, flywheels, compressor rotors, pump impellers, etc. which are connected to each other with torsional springs such as couplings and shaft sections. A simple torsional system is shown in Figure 16, and could be used as a simple representation of a motor-driven fan. The undamped natural frequency of this system is defined in Equation 1. For larger drivetrains with additional inertias, the calculations for natural frequencies become more complex.
When drivetrains are designed, it is typical that the torsional natural frequencies are calculated and compared with known excitation sources to ensure that resonant conditions do not exist under normal operating conditions throughout the intended speed range. A Campbell Diagram, as shown in Figure 17, is commonly used to determine where natural frequencies intersect with excitation sources.
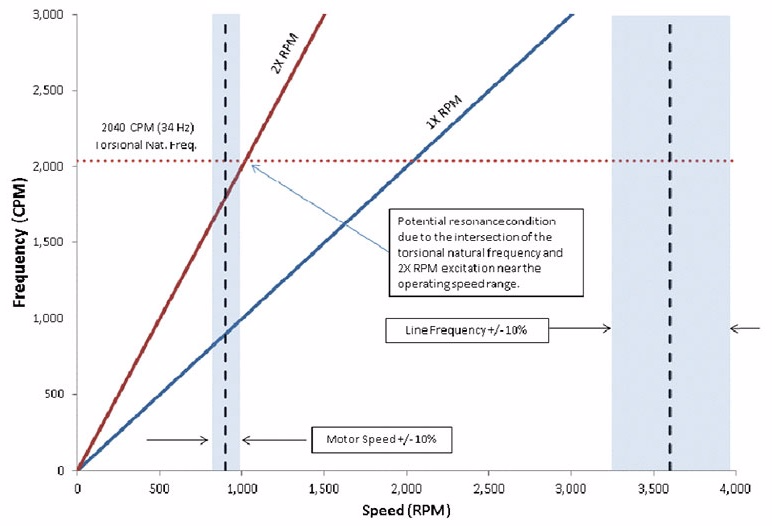
Horizontal dotted lines represent the system natural frequency. When these intersect with potential forcing frequencies (1X RPM, 2X RPM, shown in the angled lines), there is a potential that you will have a resonant condition. This is of most concern when these intersections occur within the operational speed range.
As shown in the Campbell Diagram, there is a potential for resonance while the equipment is operating within the normal speed range that which could be excited by the confluence of the torsional natural frequency and 2X RPM excitation sources. Practically speaking, this would indicate that vibrations occurring at 2X motor speed could excite the torsional natural frequency. Potential sources of this type of vibration would include shaft misalignment. Unless properly diagnosed as a torsional resonance issues, corrective actions might be incorrectly aimed at reducing shaft misalignment. In this example, while improved shaft alignment would result in a decreased excitation source, it will be difficult to reduce the amplitude of torsional vibration due to the nature of resonance.
To avoid amplification of torque due to resonance, American Petroleum Institute (API) recommends a minimum separation margin of 10% between natural frequencies and excitation sources.5 As shown in the Campbell Diagram, the potential excitation sources are shown in bands to indicate the separation margins. According to API 684, 2005, a torsional analysis should always be performed for new designs.6 However, this is not widely practiced in other industries and unfortunately torsional vibration might not be considered to be a problem until after a failure has occurred. It should be noted that the safety and reliability of a torsional system is determined by stress, not merely by separation margin from excitation sources that may or may not be of any importance.
While most equipment manufacturers will study the torsional dynamics when the drivetrain is designed, the same analysis is often neglected when drivetrain equipment is upgraded or process conditions are changed to increase plant throughput. The measurement and analysis of torsional vibration (either at the design stage or during retrofit) will help ensure process optimization and equipment reliability by mitigating the risks associated with otherwise potentially harmful operating conditions.
A torsional analysis can have varying levels of complexity. Often times, if there is no indication that the natural frequencies will be excited then that is the extent of the analysis. However, due to the uncertainties in the calculations and the potential for off-design operating conditions, it is recommended that the torsional analysis include the calculation of the forced vibration response.
A forced response analysis typically includes the creation of a mathematical model of the drivetrain and the calculation of the resultant stresses from external torques generated from the driving and/or driven equipment. The mathematical model is usually a discrete lumped mass-spring system which represents the major inertias and torsional springs in the drivetrain. Because the motion of one inertia in a drivetrain is dependent upon all of the other inertias, a system of equations based on the laws of motion is developed. Theoretical torques can be applied to the model to simulate different conditions like start-up, impacts, and resonance by altering the time-varying torque function.
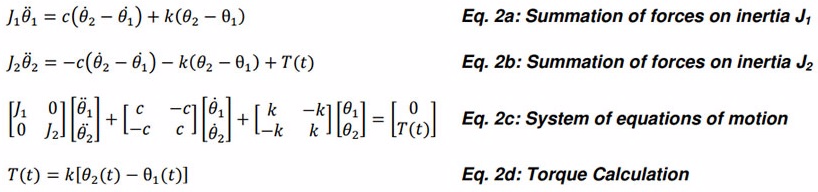
The equations of motion for each inertia can be determined through the summation of the forces applied to each inertia as shown in Equations 2 a-b for the two-inertia system shown in Figure 18. From Newton’s universal laws of motion, the summation of forces acting on an object is equal to the object mass multiplied by acceleration. In the torsional reference frame this equates to inertia (J) multiplied by angular acceleration (). When an external time-varying torque, T(t), is applied to an inertia there will be equal and opposite reaction forces transmitted throughout the drivetrain in accordance with the laws of motion. The equal and opposite forces are related to the damping and stiffness characteristics of the connecting shafts. Equation 2c shows the system of equations which is then utilized to simultaneously solve for the angular displacement (θn) as a function of time for each inertia.4 The resultant torque at each shaft location can then be calculated because torque is equal to the relative angular displacement across inertias connected by a known spring stiffness (Equation 2d).
The majority of systems are not well represented by a model with two inertias connected by a spring, and as such the system of equations will be much larger. In these cases, computer software is utilized to simulate the torsional response using numerical simulation methods such as Runge-Kutta.
These simulations are used to identify sections of the drivetrain which may be subject to high amplitude torsional vibrations. It allows designers to make modifications to the model, such as changing spring stiffness, adding damping, or changing inertia values, to determine if a positive effect can be realized. Physically, these modifications could include altering the shaft geometry (tubular or solid), utilizing an elastomeric coupling for increased damping, or adding/removing a flywheel to the drivetrain. If modifications to the drivetrain components is not possible, the analysis may still yield information as to the best location to use a torque overload or limiting device. As these types of alterations can pose significant costs in terms of new components and downtime, it is essential that effective and accurate modeling of the torsional dynamics be completed. When possible, it is best to use empirical data from field torque measurements to validate and normalize the torsional model.
Predictive Methods
The direct measurement of torque is the best method for addressing uncertainty in natural frequency and forced-response calculations, evaluating the effects of operational changes (load and/or speed), and capturing transient events which could reduce system reliability. The location on the drivetrain where torque is measured is important to consider for useful data to be acquired. Large inertias, such as gearboxes, tend to isolate the driving and driven sides of the drivetrain from transient torque events because they act like flywheels. The measurements need to be taken at a location where there is enough angular deflection to produce a signal in the torque transducer; meaning that short, solid shaft sections may not deflect much under loading. Lastly, for torque sensors such as strain gages, the shaft section geometry (and material properties) where the gage is installed needs to be known so that torque can be calculated from the measured strain. Complex geometries will make the relationship between strain and torque difficult to calculate.
Often, electrical torque measured at the motor is used to determine the torque downstream in the drivetrain. While this is usually adequate for steady-state torque, the electrical torque at the motor does not react quickly enough to torque spikes generated at the driven side of the drivetrain. In VFD-controlled motor applications, the source of torsional vibration is commonly generated from the drive. The VFD is used to control the motor speed by manipulating the frequency of their output by rectifying an incoming AC current into DC, and then using various methods (commonly pulse width modulation) to recreate an AC current and voltage output waveform. While newer VFDs produce smoother outputs and reduce the amplitude of the associated torque ripple, it has been seen that tighter speed control can cause other instabilities as the drive tries to make quick corrections due to the excitation of a TNF which has been misidentified by the drive as a load change. Tighter speed control is also problematic when the motors are driving larger inertias (large diameter fans, gearboxes, etc.) which inherently do not react to sudden speed changes because they tend to act like flywheels.
Changes in the output frequency waveform can produce corresponding torque fluctuations. Generally, the torque ripple for smooth operation should be 1% or less.8 It would seem logical that the feedback from the drive could be utilized to measure the transient torques; however, the torque data is usually only recorded at 10 Hz (samples/second) which is generally too slow to capture transient events without truncating the waveform peaks.
Transient events such as impacting, start-ups, and process upsets can produce torque spikes whose first (and largest amplitude) cycle of vibration occurs over only several milliseconds. In order to adequately capture the waveform, without truncating peaks, sampling rates typically need to be at least 500 Hz (Samples/second).
Several common technologies capable of measuring transient torque are available including: phase displacement systems, strain gages, and optical encoders. A comparison of the different technologies is shown in Table 1, where an ‘X’ indicates that the technology is suited for the specific criteria or condition listed in the first column. The choice of the particular technology largely depends on the intended use and application.
The digital signal from the transmitter is sent wirelessly (RF, Bluetooth, or wired) to a signal receiver that can provide various analog outputs (4-20 mA, 0-10 Vdc, etc.) that can be recorded. A gain (multiplier) and offset are applied to the analog output signal to provide a torque value based on the known material dimensions and mechanical properties of the rotating shaft/coupling.
Phase displacement systems utilize toothed wheels that generate a pulse each time a tooth passes the sensing element. The time difference (detected by sets of opposing sensors) between the teeth on the driving and driven tooted wheel is used to determine the amount of angular deflection that exists between the wheels of a known stiffness, and therefore the torque being transmitted. An example of the AC voltage waveforms produced by the two gear wheels passing the sensors is shown in Figure 19. These systems are a good choice for continuous duty use where a high degree of accuracy is required for process optimization and performance validation. Phase displacement torque measurements systems are typically installed in turbomachinery applications and are not viable solutions for low speed (< 500 RPM) equipment.
Optical systems typically employ banded or “zebra-tape” coders adhered to the rotating shaft and an optical encoder to detect the changes in color as the tape passes the encoder. Optical systems are another option for temporary measurement of torque but have some limitations in environments that have grease/oil that could impede the optical sensor or heat which degrade the adhesive. Additionally, algorithms for signal processing need to be developed to address the overlap of each banded tape segment to avoid false measurements.
Strain gages, which consist of electrical resistors oriented in a Wheatstone bridge, are mounted to the rotating shaft or coupling, connected to a signal transmitter, and powered inductively or by batteries. For transient torque measurements, selection of a system with adequate sampling rates is necessary as some systems are designed only for intermittent measurement.
Table 1: Relative Comparison of Torque Measurement Systems.
| Commissioning/Diagnostics | ||||
| Continuous Duty | ||||
| Low Speed | ||||
| High Speed | ||||
| Harsh Environment | ||||
| Lateral Shaft Movement | ||||
| Relative Cost |
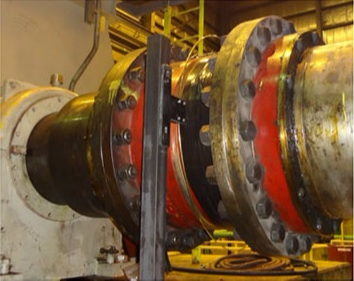
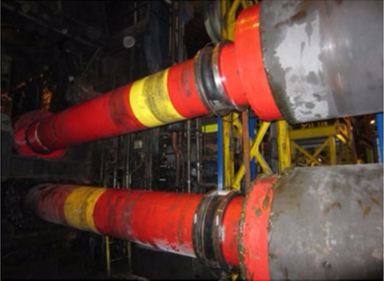
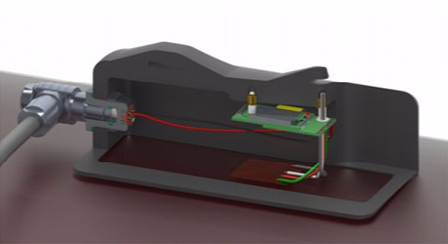
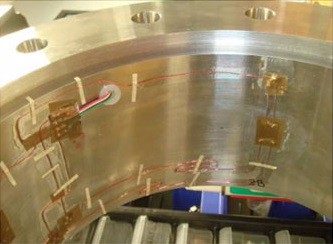
The desired length of uninterrupted measurement is the first criterion that should be considered when selecting a torque measurement system. Significant costs can be avoided through the selection of a simple system. Often, torque measurements are only required temporarily for validation of theoretical models, commissioning, or diagnostic purposes. In these cases, strain gage systems are commonly used. An example of a temporary installation of a strain gage system is shown in Photograph Figure 20. The gage and RF transmitter are attached to the rotating shaft, in this case a shear spacer. A brass hoop antenna is installed around the circumference of the shaft and receives the RF signal from the transmitter. In certain designs, this type of setup can also serve to provide inductive power to the transmitter, eliminating the need for batteries. Figure 21 shows a permanent installation using a similar strain gage telemetry system. The electronic components on the rotating shaft are protected by the rubber and metallic enclosures mounted to the shafts. An alternate enclosure used to protect the gages and transmitter is shown in Figure 22. This particular system does not require a hoop antenna and transmits the signal wirelessly to a receiver and processing module. In higher-speed applications, the mounting of electronics on a rotating shaft can introduce imbalance, creating other problems. In these cases, the transmitter assembly mounted to the shaft should be counter-balanced with a weight installed at 180 degrees. In balance-sensitive applications, the components should be dynamically balanced once the telemetry system is installed. Tubular shafts provide an option for the gages and wiring to be installed on the inner diameter which provides additional protection and secures the wiring (Figure 23).
As with linear vibration, the time-waveform and FFT spectrum of the torque data provide the analyst with information needed to identify the torsional vibration severity and source, respectively. Values from the time-waveform can be directly related to stress, which allows for evaluation of the drivetrain reliability in terms of fatigue and yield safety factors.
The spectral data will provide the analyst with information on the frequencies present in the waveform. Process conditions and angular clearances such as backlash or wear can produce torsional oscillations within the equipment; however, it is more common to see the system natural frequencies in the in the spectral data. This is the frequency which the shaft(s) oscillate at after an impacting load or when the operational speed coincides with a torsional natural frequency. While there are an infinite number of torsional natural frequencies for a drivetrain, it is likely that only the first and sometimes the second TNF are observed. Higher-order natural frequencies are much less energetic and more difficult to excite. The spectral data can be utilized to verify theoretical calculations of torsional natural frequencies so that changes to operational speeds can be properly evaluated, ensuring that adverse conditions are avoided. Additionally, the empirical data will allow for the mathematical model of a drivetrain to be ‘normalized’, providing confidence in evaluating any changes (motor upgrades, coupling changes, etc.) proposed to the drivetrain to improve reliability without introducing unforeseen problems.
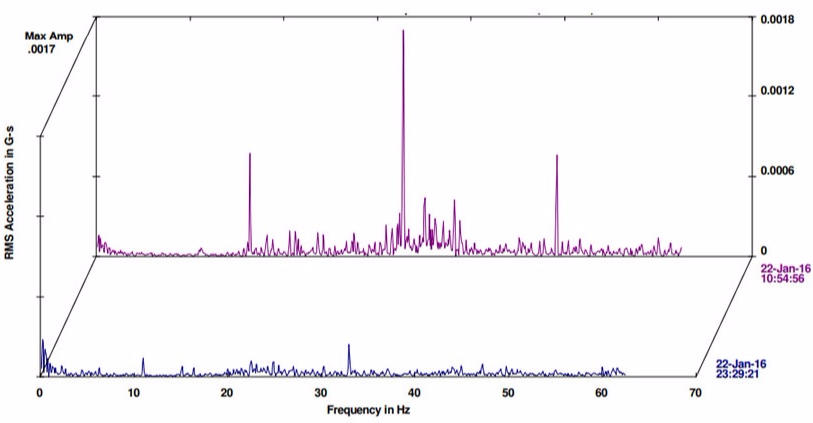
For applications that are susceptible to torsional vibration (either due to resonance at operating speeds or from impacting loads), the integration of torque measurements with radial and axial vibration from eddycurrent probes or case-mounted accelerometers can provide a comprehensive condition monitoring system. First, the torque measurements can be used to trigger predicate-based recording of vibration data. Because light and intermittent loads can pose difficulties in the collection of useful vibration data, torque measurements can help analysts distinguish between data which is representative of a fault and that which is just a characteristic of how the equipment is operated. To illustrate this, data from an online vibration monitoring system which simultaneously records torque and vibration data on a metal rolling application is shown in Figure 26. The figure shows spectral data recorded with a case-mounted accelerometer on the reduction gearbox, which is intermittently loaded. The vibration measurements for lightly-loaded (blue) and fully-loaded (purple) conditions were triggered by a signal from the torque measurement system installed on the output shaft of the gearbox. The difference in the spectral data is obvious, but without knowing the transmitted torque, it would be difficult to determine if the vibration increases are due to load or a fault in the machinery.
In addition to using the torque data for discerning the effect of load on vibration measurements, the torque measurements can also be used to alert operators to adverse conditions. When the amplitude of torsional vibration is measured continuously, the number of instances where the amplitude exceeds a certain threshold can be counted, allowing for corrective actions to be taken before fatigue failure occurs. These thresholds can be determined from stress analysis of the torque transmitting component, or based on a multiple of the nominal operating torque which would indicate abnormal conditions. An example of a torque trend is shown in Figure 27 which includes several instances of high amplitude torque spikes.

The measurements prompted maintenance personnel to remove the components for inspection and repair, during which time small cracks were found. The identification of these fatigue cracks would have remained hidden without transient torque measurements until further propagation or fracture. Additionally, the removal of the component before the cracks propagate further can significantly reduce equipment downtime associated with the complete fracture of the components.
Conclusion
Harmful torsional vibrations can occur due to process conditions and transient events, or can simply be inherent to the design of the drivetrain. As most equipment is not instrumented to measure these vibrations, failure is often the first indication of their presence. In some cases, preventive (time-based) tasks can be used to identify the presence of torsional vibration, but these methods have limited effectiveness in determining the severity and source.
Drivetrains susceptible to torsional vibrations are used in numerous industries and include slow speed equipment as well as turbomachinery. API standards (617, 2002 and 684, 2005) provide guidance on torsional modeling, natural frequency calculations, and recommended margins of separation to avoid resonant conditions. Unfortunately, these standards are not used to the extent they could be in other industries to avoid failures due to torsional vibration.
Predictive methods which include the measurement and analysis of transient torque can be employed on a temporary or continuous basis. Torque measurements can be utilized to evaluate stress safety factors for new designs, throughput increases, and other modifications to the drivetrain. Additionally, continuous torque monitoring can be utilized to capture adverse conditions which could initiate fatigue cracks in drivetrain components, which are difficult to detect with conventional vibration analysis.