Rotary equipment multi-plane balancing program
It's time to announce the release of the first version of the multiplane balancing calculation program. I bring to your attention a small overview of the program.
The creation of the program was prompted by the desire to facilitate / automate one's work when balancing rotary equipment. What are the main disadvantages of most balancing programs? First of all, there are their limitations associated with the number of measurement points and balancing planes (this is a problem for most devices and individual programs). Secondly, there is no control over the balancing process.
In this regard, the need arose to create a simple multi-plane balancing program that allows you to monitor the progress of balancing using balancing pie charts. The calculation is based on the algorithm from the tutorial Vibration diagnostics and vibration balancing of a wind turbine with a vertical axis of rotation . The balancing device K-4102M works on the basis of the described algorithm. It would seem that it remains to transfer this algorithm into the code and the program is ready. But, either the developers made a mistake, or deliberately kept silent about it. During testing, it was found that in some situations the calculation gives a close solution, in some absolutely bad masses, and in some it has no solution at all.
For advice on this issue, I turned to a very good person / engineer / scientist (hello, Vasily!), Who explained on his fingers the need and essence of matrix regularization according to paragraph 7.1.3.5 of the methodology. With his assistance, the equation was slightly modernized and an algorithm for calculating the regularization factor was developed. Further testing showed that the calculations were correct.
Let's move on to a small tour of the program using the example of real balancing. When launched, the program invites us to start a new balancing.
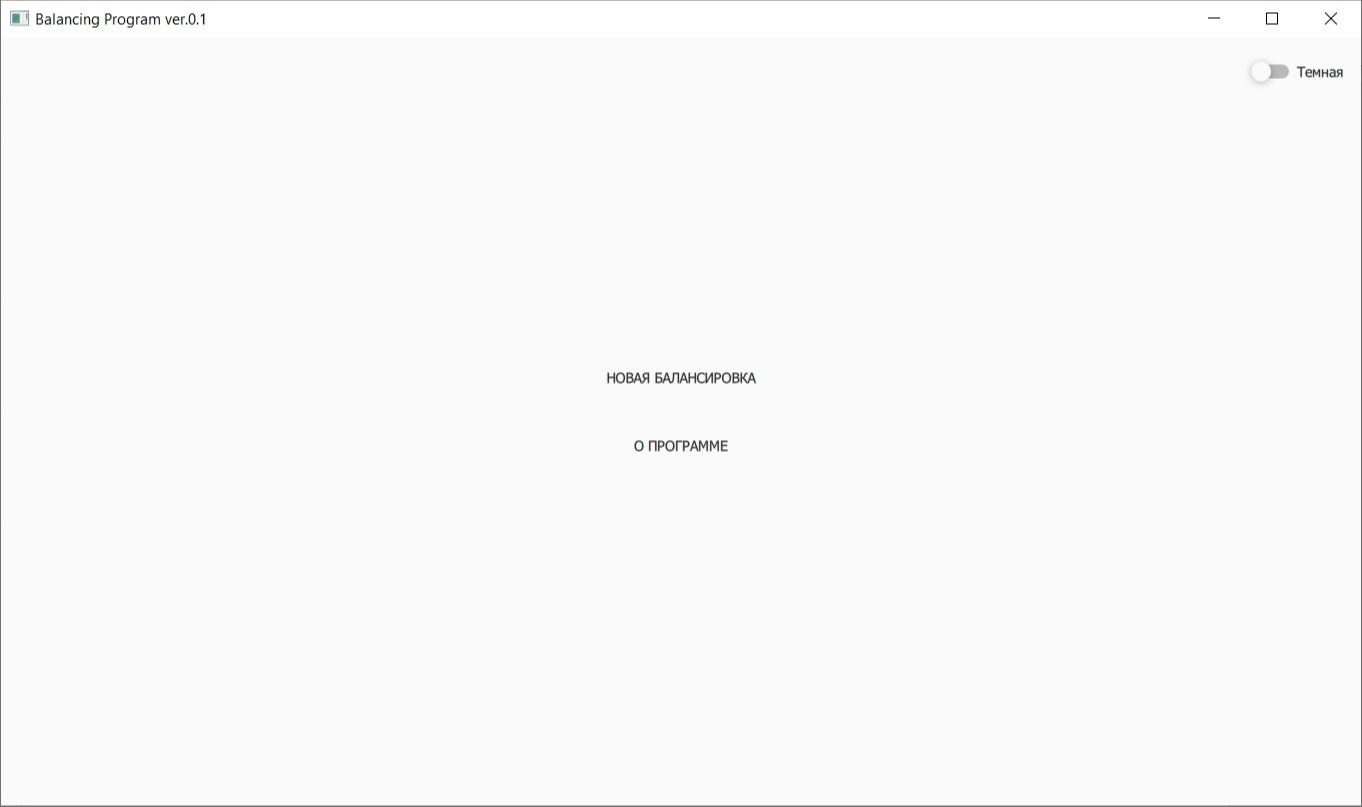
In this window, you can choose a light or dark theme for the application (for an amateur). Next, go to the window for selecting vibration measurement points and balancing planes.
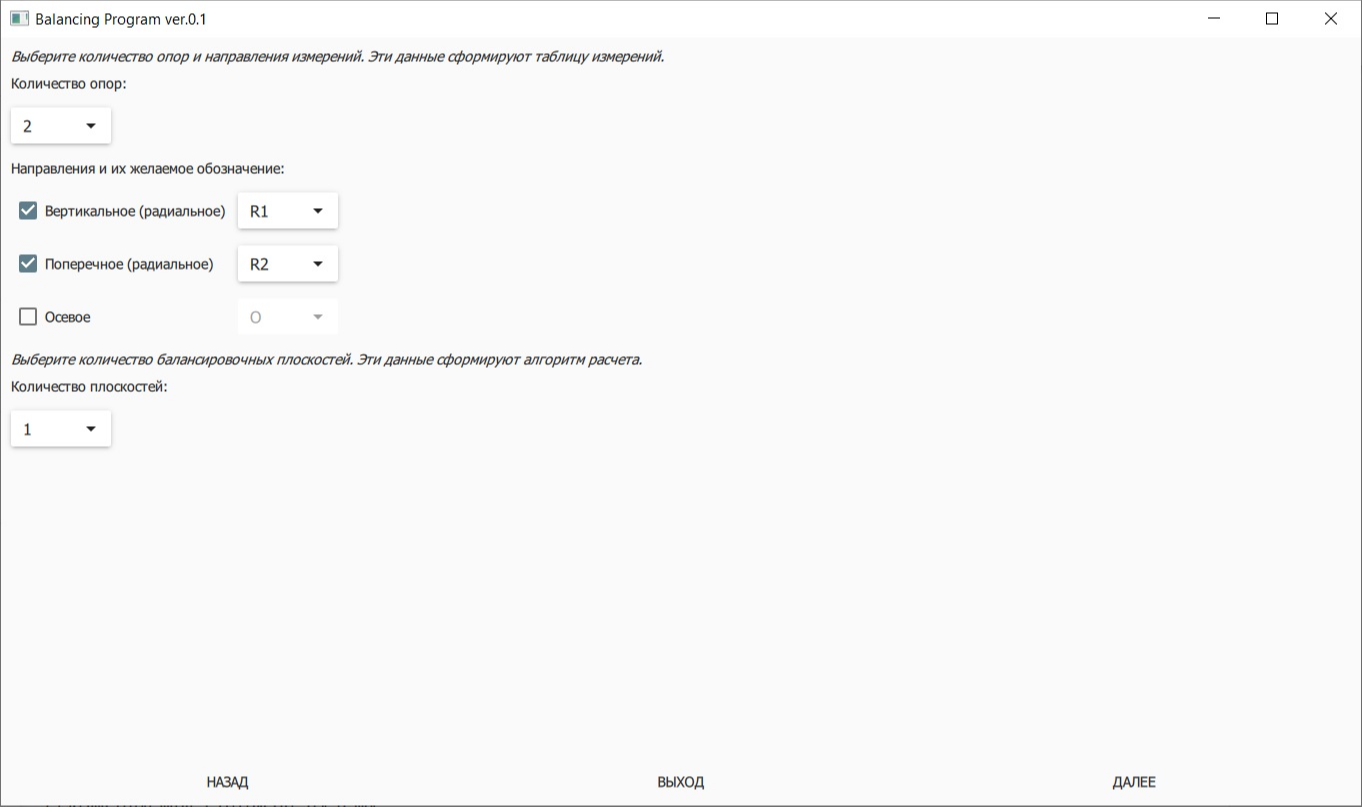
As with conventional vibration monitoring, the bearing support can have three mutually perpendicular measuring points. Based on personal experience, balancing in axial directions is also possible, therefore this direction is available for selection. Since the names of the directions of the measuring points depend on the position of the balanced equipment (vertical or horizontal) and on the naming system adopted at the enterprise, a choice of direction names is available. In this example, the equipment is vertical and the measurement directions are selected as R1 and R2.
Next, we proceed to enter the data of the initial vibration (amplitude / phase of the reverse frequency).
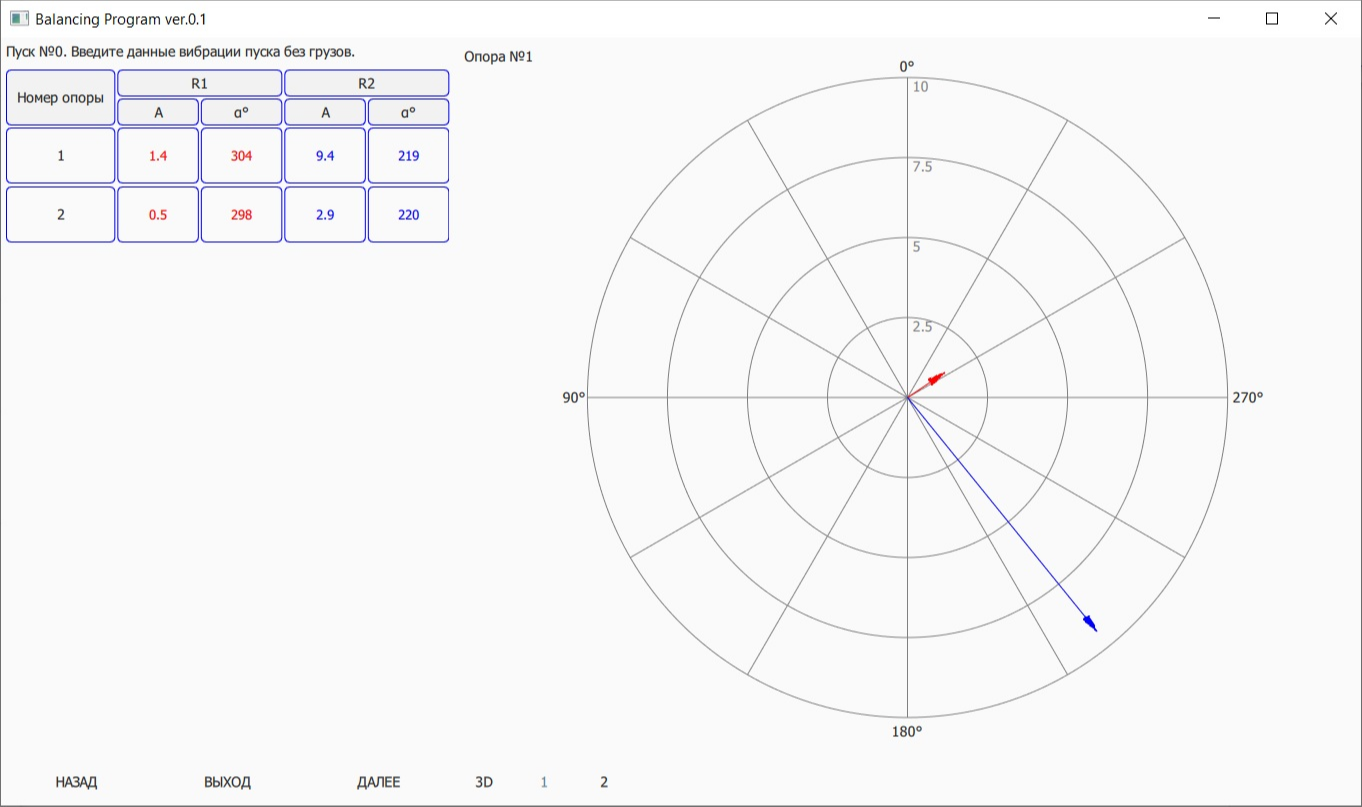
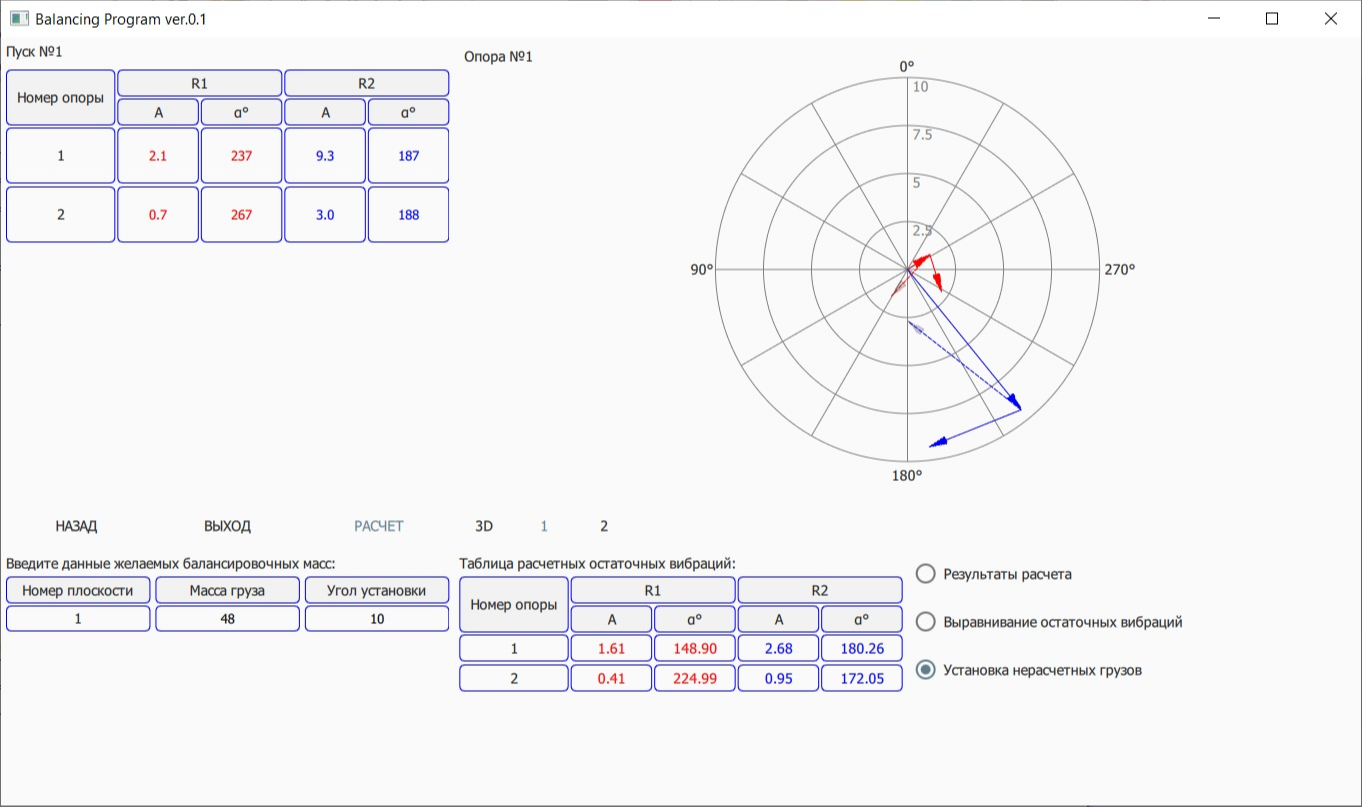
When data is entered into the table on the left, imbalance vectors are simultaneously constructed. The autoscaling function works on the chart. The choice of a graph for a specific support is carried out by clicking on the appropriate button under the graph (the 3D graphics function is not available in this version). Do not pay attention to the huge difference in amplitudes in the R1 and R2 directions - balancing is carried out at resonance in the R2 direction.
For the balancing calculation, we need the installation of a test weight and information on the change in vibration from it. We indicate the mass and angle of installation of the test weight.
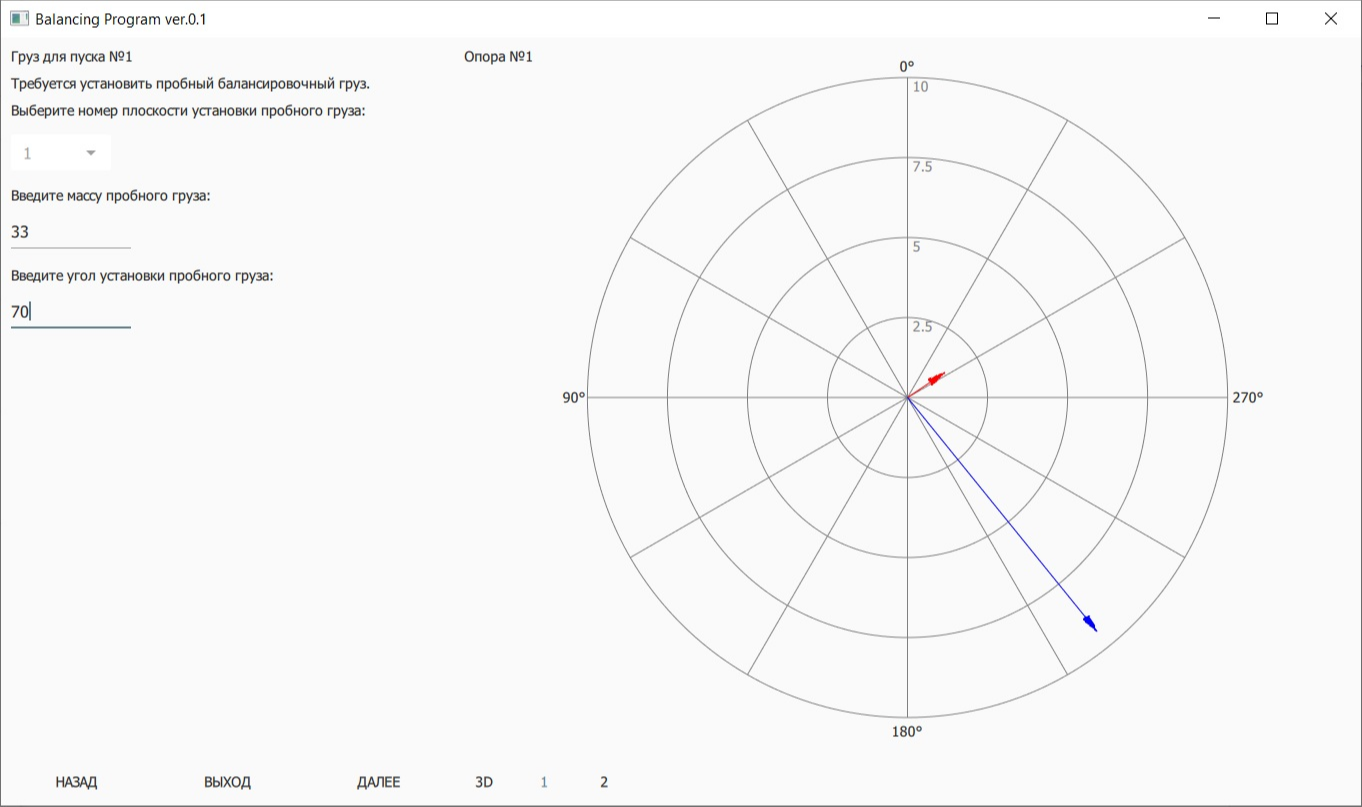
We enter the amplitude / phase of the start-up No. 1 after the installation of the trial weight.
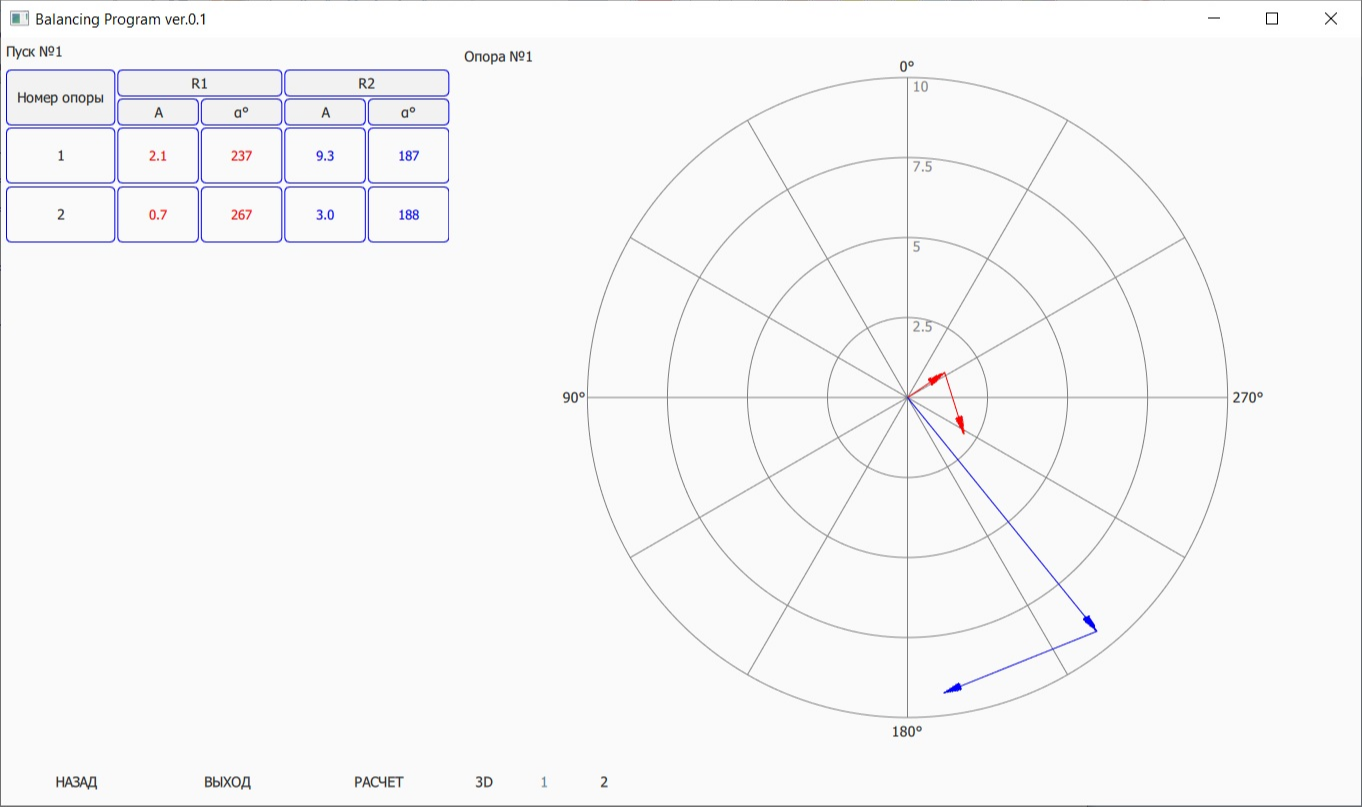
On the balancing diagram, when entering data from the ends of the vectors of the initial imbalances, the influence vectors of the test weight are built. The condition for plotting the diagram is standard - counting the phase against rotation, i.e. clockwise rotation on the graph. It is already visually clear that the sensitivity to the load is good and the rotation of the influence vectors (the position of the test load) by about 80 ° in rotation suggests itself.
We carry out the calculation.
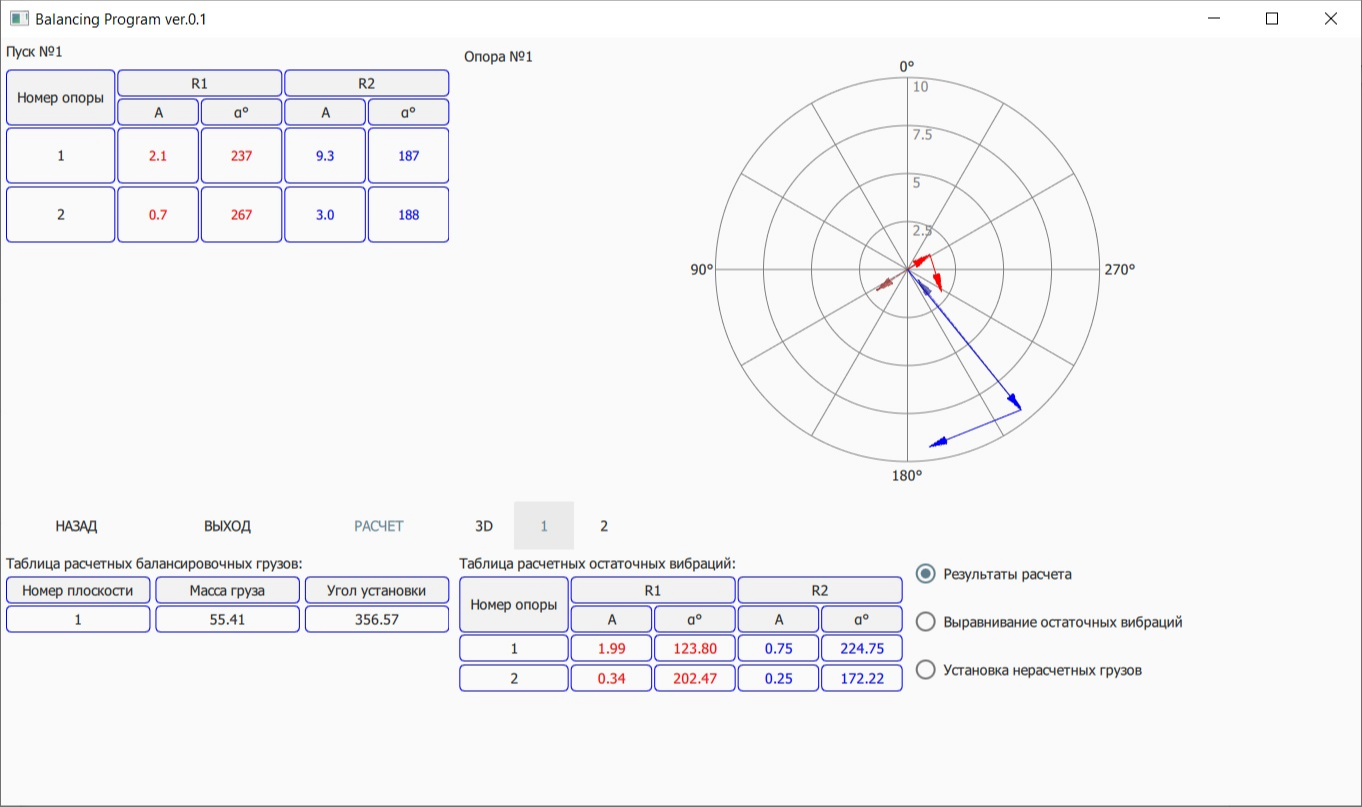
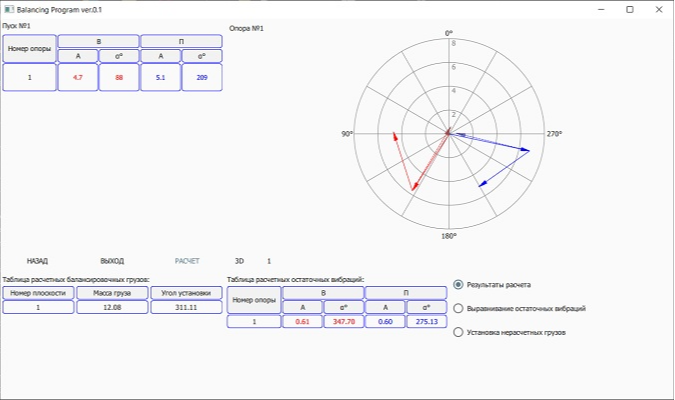
Additional flickering vectors of influence from the calculated weight appear on the graph. At the bottom appeared tables with the calculated mass and angle of the balancing weight, as well as the expected residual vibrations after installing the calculated weight. As you can see, at the point 1R1, the amplitude of the residual vibration is several times higher than the residuals at other control points.
To smooth out residual vibrations, select the appropriate function below the graph.
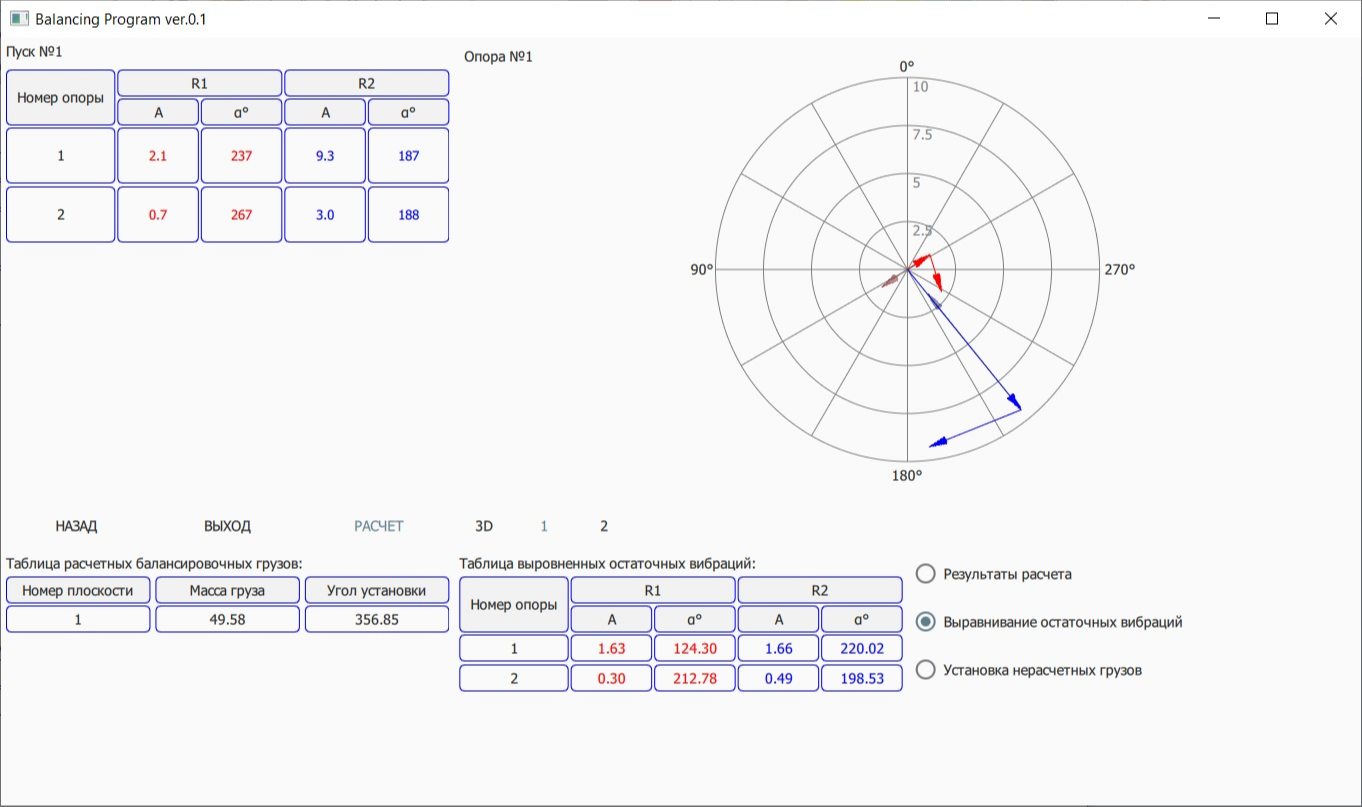
As you can see, we can slightly reduce the vibration at the 1R1 point by increasing it in the 1R2 direction. The calculation data completely coincide with the calculated data of the balancing program of the VIBXPERT II instrument from PRUFTECHNIK.
In reality, we cannot measure the mass and angle of installation of the balancing weight so accurately, we cannot always gain a certain mass and be able to set it to the desired angle. To assess the residual vibration after installing a similar in weight load in the nearest accessible place, use the function of setting off-design weights.
The functionality is minimal at the moment, but I hope the interface is convenient. I hope for your criticism, support and wishes.
In the near future it is planned:
1. Mobile version on Android.
2. Database of balances.
3. 3D graphics (vectors in all supports at once).
You can download the archive with the program (48.7 MB) following this link .
Forum discussion.
Большое спасибо за программу, реально очень полезный инструмент позволявший кардинально ускорить и упростить процесс балансировки. Особенно благодарен за мобильное приложение, очень удобно при балансировке по месту в собственных опорах быстро проверить свои расчеты.