Calculating a vertical pump motor reed frequency and subsequent system resonance
Резонанс, Модальный анализ, Собственная частота, Вибродиагностика
As part of a seismic analysis for a 1000 horsepower vertical 14 pole induction pump motor the reed frequency was calculated using a finite element analysis (FEA) program. This paper will discuss the FEA modeling for the seismic analysis and natural frequency determination. The calculations were done for the
motor only on a rigid support. After the motor completed the standard factory tests, an impact test was conducted in the rigid mount condition to determine the structural natural frequencies. The tested values will be compared to the calculated values from the FEA model. This paper will also discuss the subsequent motor/pump system resonance problems that surfaced after the motor/pump was installed on site. This paper will highlight the importance of the system integrators design of the motor support structure to avoid structural resonance problems such as in this case.
Introduction
To determine the seismic accelerations that the motor will see the first step is to conduct a modal calculation, in this case using a finite element analysis model. Of particular importance is the first mode natural frequency which typically has a very high mass participation. This is the dreaded “Reed
Frequency” of a vertical motor. After seeing the results of the rigidly mounted model, and knowing this was a variable frequency drive application there was a strong chance the motor could have a resonance issue if installed on a weaker support. These issues cause long delays and much finger pointing usually starting with the finger pointed at the motor supplier. This will typically result in an angry phone call from the customer complaining of high 1 times operating speed vibration and blaming the motor manufacturer for poor balancing. This scenario happens all too often and is never a balance problem. Although we are occasionally asked for motor seismic data, we rarely see where someone has been contracted to perform a complete system analysis of the motor, support, pump, and piping. The customer was cautioned that they should have a more thorough analysis performed, but they only wanted to know how the motor would behave.
Seismic Analysis
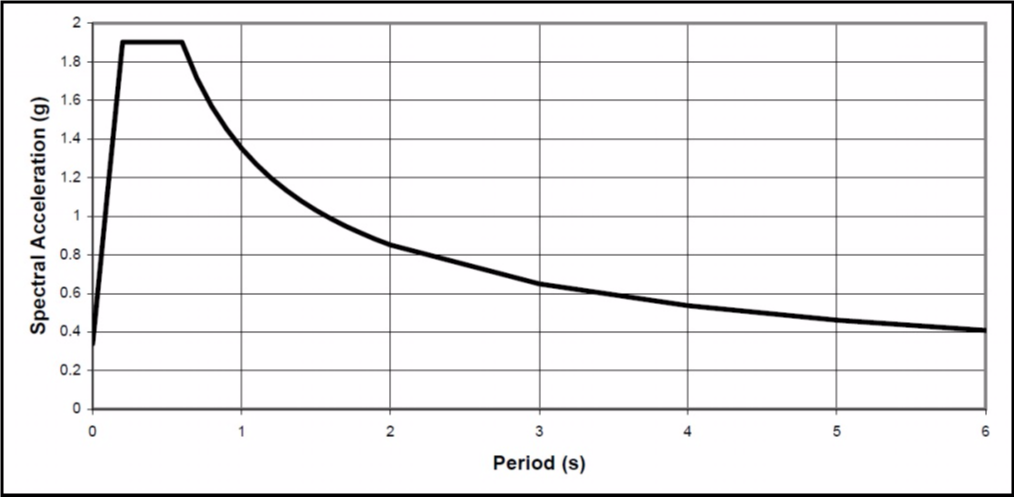
Using the appropriate code we can obtain the response spectrum for the site location and conditions. Figure 1 shows a typical plot. To keep the location of this equipment confidential we are not showing the actual data used in this analysis. The peak spectral acceleration can be found from the plot once the fundamental period of the structure is known. Inverting the calculated first mode natural frequency will provide us the period. It can be seen for very low frequencies (high period) the spectral acceleration is decreasing in value.
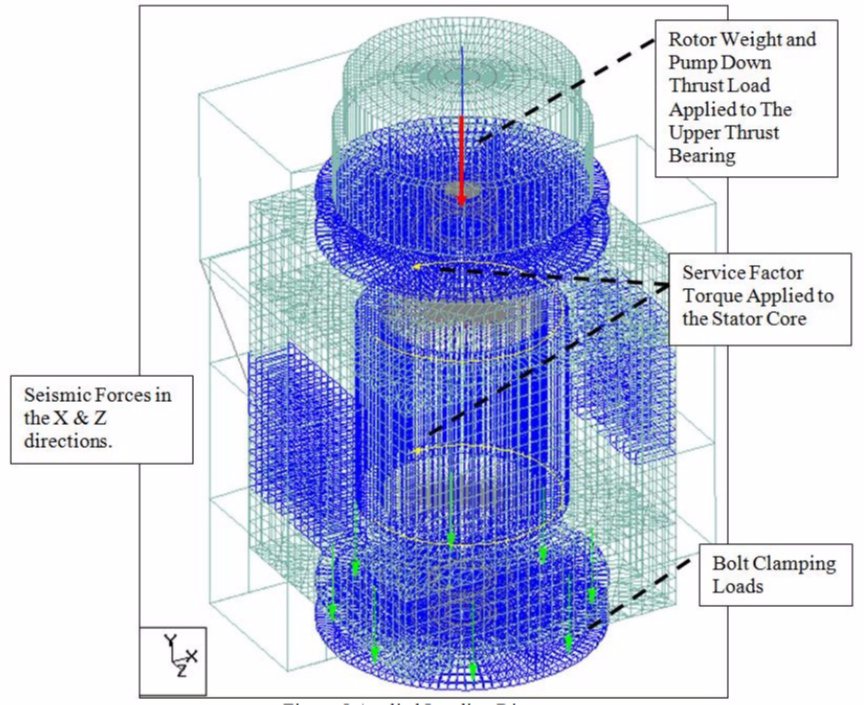
The FEA program will calculate the natural frequency and apply the seismic load case to the structure. It was agreed that the seismic event loading would be combined with the full service factor loads of the motor operating at rated speed. Since the motor is designed to withstand much higher torques during startup and transient conditions and this was not an extremely high seismic area it was felt that no real modifications to the motor design would be needed. Figure 2 shows an isometric view of the motor.
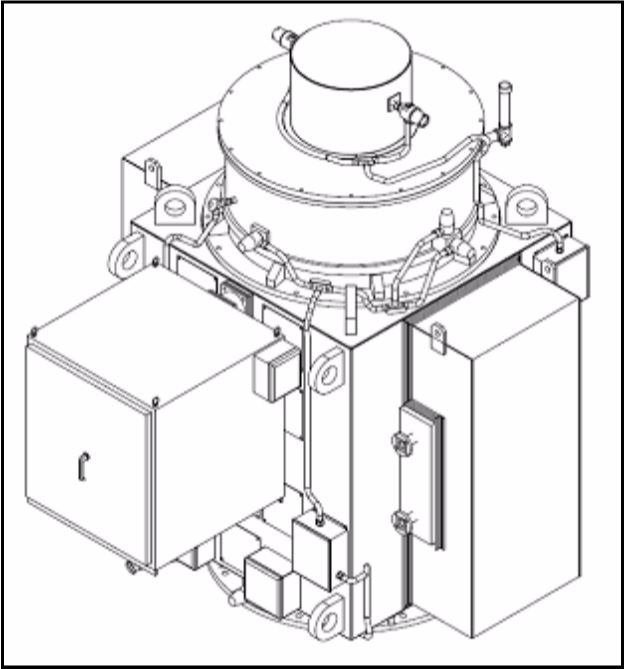
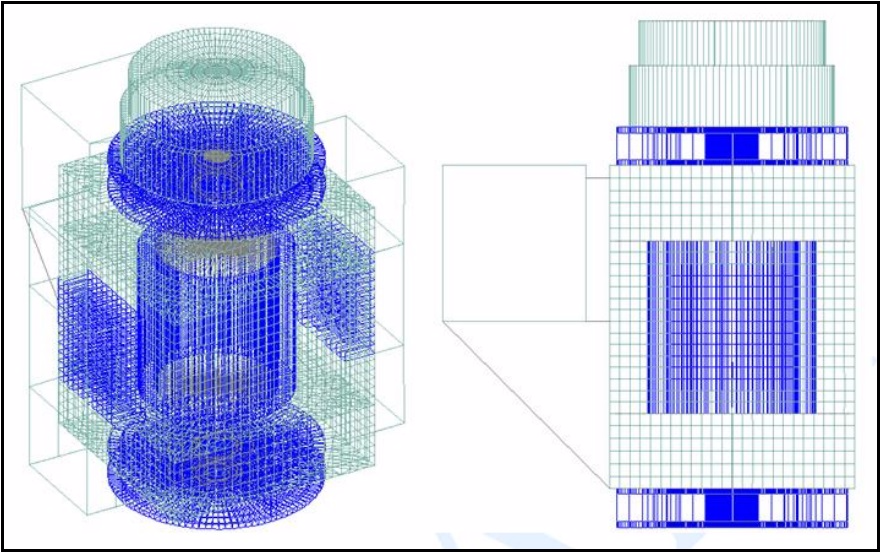
This motor is a totally enclosed water to air cooled unit. The upper bearing is a combination thrust and radial sleeve design. The lower guide bearing is a single row deep groove ball bearing. The motor was modeled assuming water weight in all the heat exchangers and full oil capacity in the upper bearing reservoir. The FEA model was created with a combination of solid and plate elements as shown in Figure 3. In order to evaluate the rotor and bearing system another FEA model was created. That system is not discussed in this work.
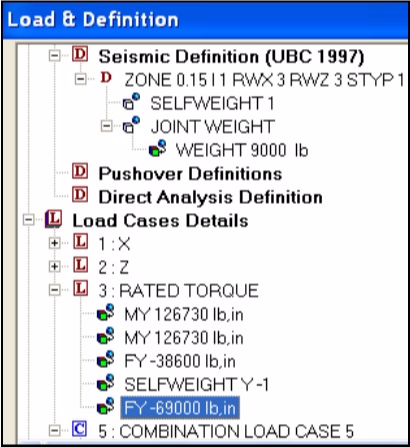
In order to get an accurate calculation of the natural frequency it is important to model the rotor weight that is basically hanging from the upper thrust bearing. This weight was modeled as a joint weight of 9,000 pounds which is the weight of the rotor. This is a mass that doesn’t contribute to the structural stiffness of the motor. The seismic loading is computed with the self weight of the motor and 9,000 pound joint load along with the seismic criteria. Then the seismic loads are applied in both lateral directions. The loading at 1.15 service factor torque was created as a separate load case by applying the torque reaction at the two stator to frame connection points. The other loads applied in this case are for the rotor weight plus maximum down thrust from the pump (combined load of 69,000 pounds), and the motor hold down bolt loads of 38,600 lbs each at eight places on the lower bearing bracket. The seismic and service factor loads were combined using the square root sum of the squares load combination within the FEA software. Figure 4 shows the FEA load case setup. Figure 5 shows the loads applied to the model.
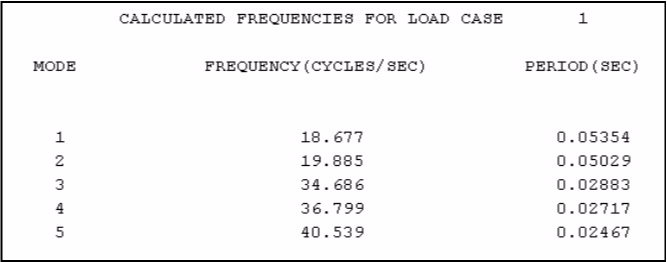
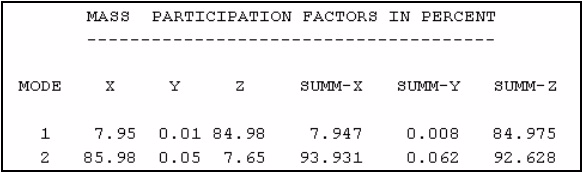
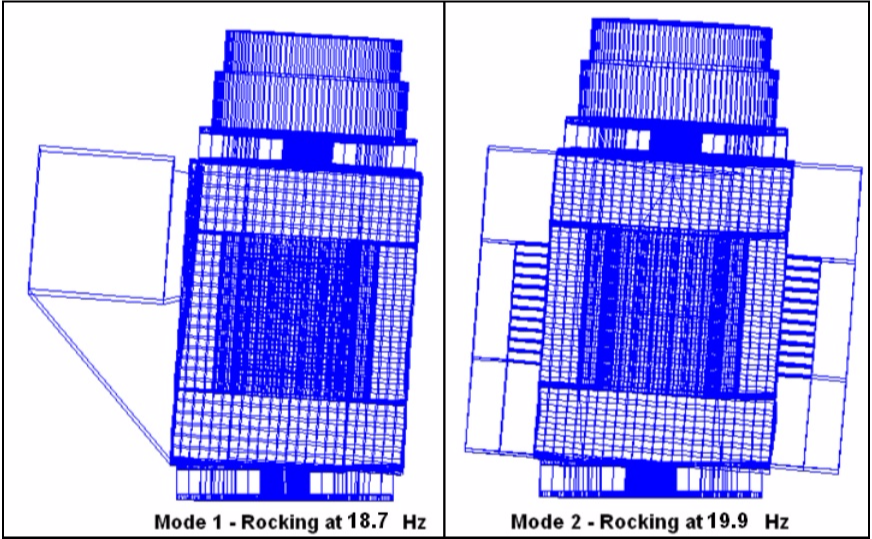
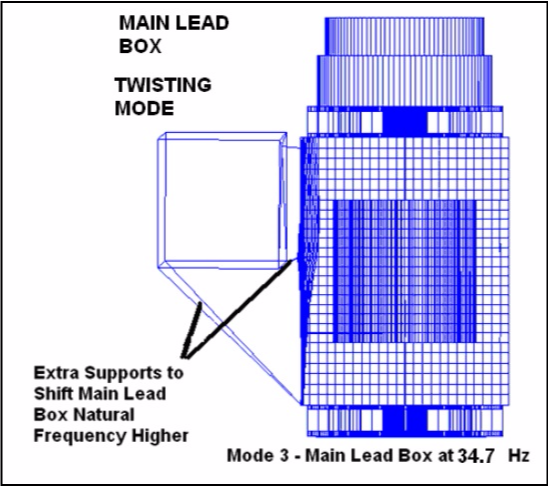
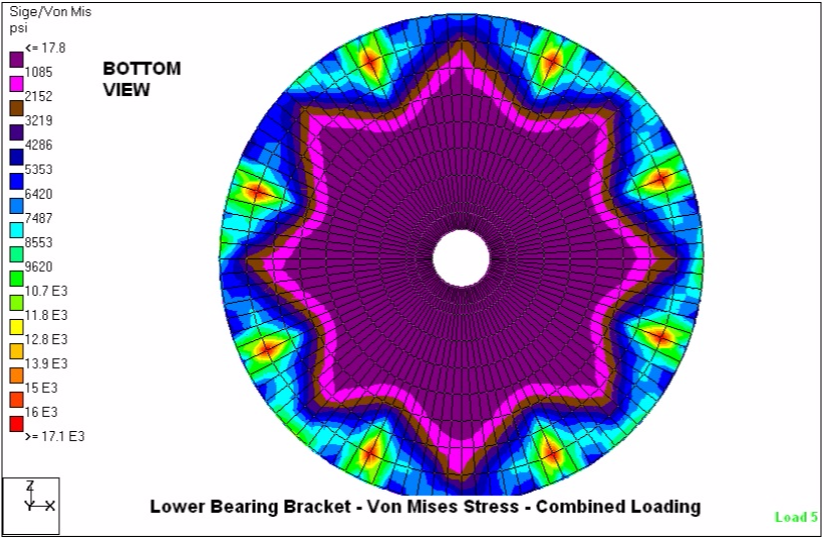
The calculation was run with the bottom of the motor support in a fixed condition and the results were reviewed for stresses and deflections. The calculated natural frequencies are shown in Table 1. Table 2 shows the mass participation factors. The first two modes are shown in Figure 6 and the main lead box mode is shown in Figure 7. The highest stressed frame component was the lower bearing bracket and is shown in Figure 8. All of the motor structure was evaluated and the stress levels were found to be acceptable.
The first two modes are the motor rocking modes (reed frequencies in the X and Z directions). Modes 3-5 are modes of the main lead box twisting. The main lead box required some additional support based on this result.
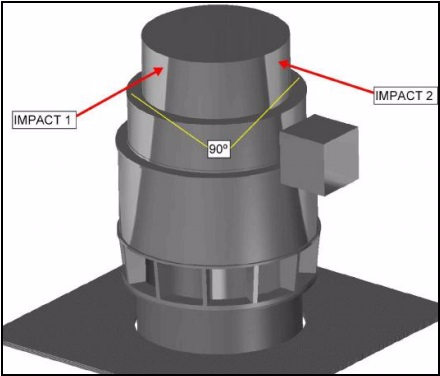
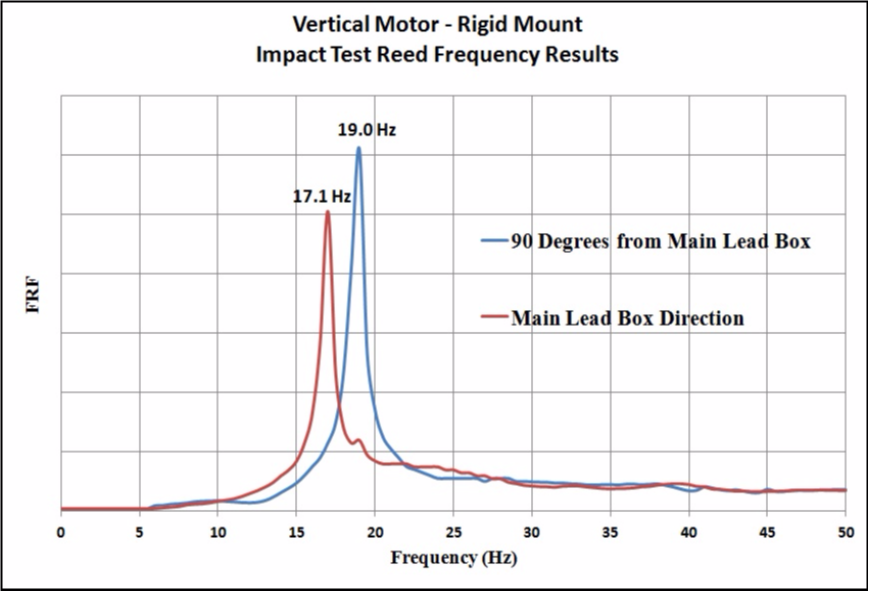
Once the motor was manufactured it was securely mounted to a massive floor plate and impact tested. The typical convention for the test is shown in Figure 9. The motor is impacted in two directions 90 degrees apart. First, in line with the main lead box, and then 90 degrees away from the main lead box. The impact and response are taken at the top of the motor. The impact test results are shown in Figure 10. The test results are within reason for the modeling uncertainties and the mounting method used on the test floor compared to the truly fixed condition applied in the FEA model.
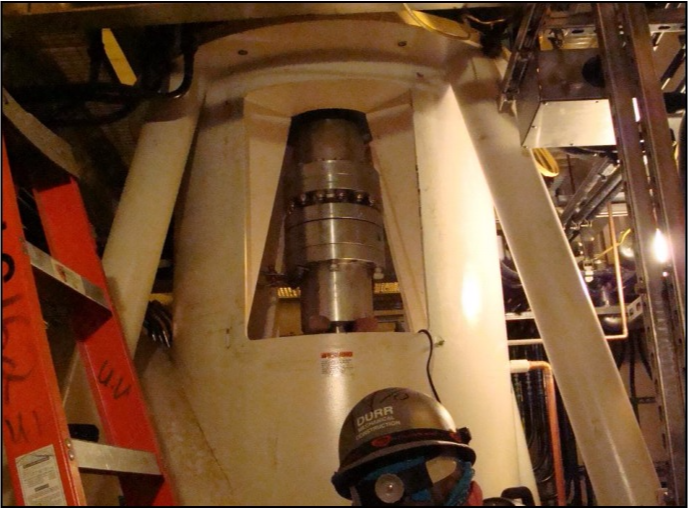
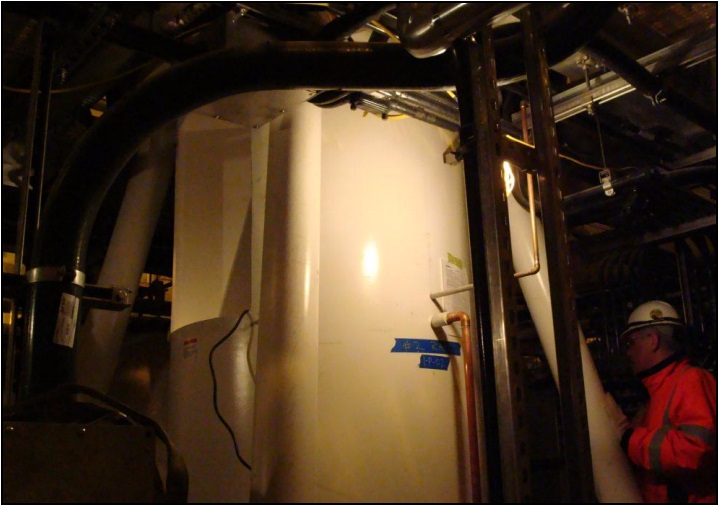
Once the units were installed in the field, the complete systems presented natural frequency issues at approximately 9 Hz as verified by a speed sweep using the VFD. Initially some vibration readings approached 1 in/sec peak at the upper bearing location. Through a combination of fine balancing and adjustment of the VFD operating speed ranges the motors are able to operate under vibration alarm limits but it took a great deal of work to get there. Figures 11 and 12 show some pictures of the motor support.
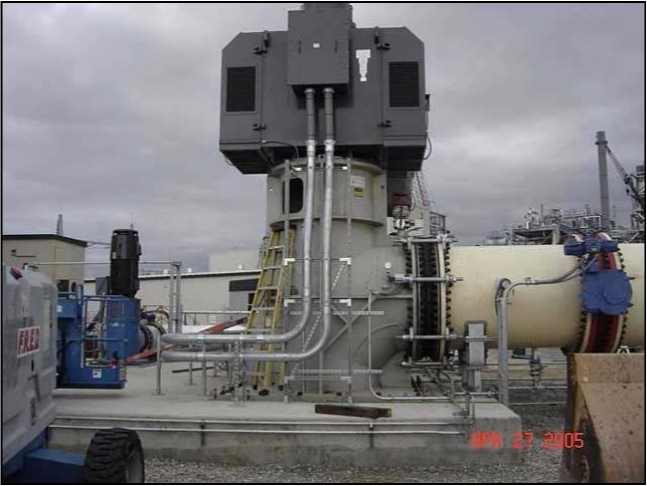
Another example of a vertical motor installation with a resonance issue is shown in Figure 13 to better illustrate a problematic mounting scenario. The combination of non-symmetric support system and nonsymmetric motor structure typically cause two closely spaced natural frequencies in orthogonal directions making this problem difficult to overcome due to a wider resonance range.
Test Your Knowledge
Your 60 Hz, 6 pole fixed speed vertical motor is tested at the factory on a rigid base and is operating on the reed frequency as shown from the coast down plot in Figure 14. Is this a problem?
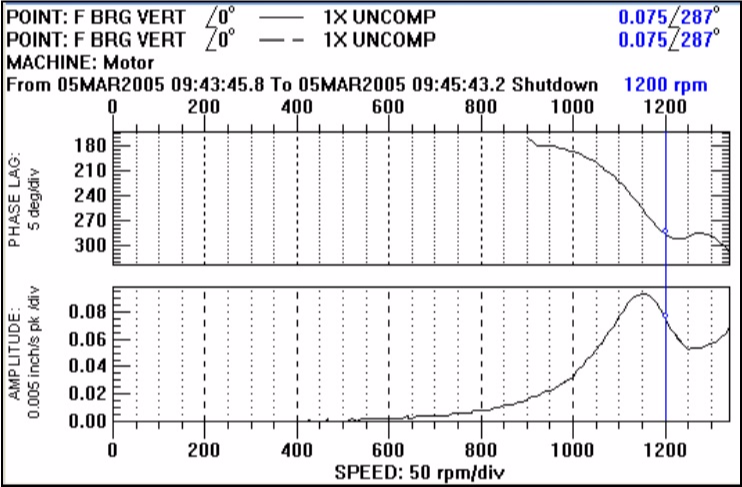
The answer is a confident “No”. That is what the authors told the customer in this case. “No need to worry, once it is mounted on your field support it will shift the reed frequency much lower and you will operate above it.” The customer was not completely onboard with this idea and the site needed the motor to be installed immediately during an outage which had already started. The customer accepted the motor on the condition that the reed frequency would be tested in the field and would be acceptable along with the operating vibration levels. So the authors tested it in the field and it rang at a beautiful 12 Hz. So it shifted from 19.2 Hz down to 12 Hz. Bottom line, you can see a 50-60 % decrease in the reed frequency from a rigid to real world condition. The customer later told us that this motor install was the only thing that went right during the outage. Go figure, it ran smooth.
Conclusions
It is important to model the rotor weight and position accurately for the FEA model to calculate the first mode natural frequency. In this case the rotor is a hanging mass with no stiffness contribution to the overall structure. It just goes along for the ride.
Reed frequency analysis plays an important role in the successful application of vertical motors. The motor reed frequency, weight, and center of gravity can be obtained from the motor manufacturer. This information can be used by the system designer as inputs to the complete system model to properly design
the system and avoid costly resonance issues.
Authors:
Bill Branca, P.E.
Infigen Energy,
2802 Flintrock Trace Austin, TX 78738
Bill.Branca@infigen-us.com
Bryan Evans
TECO-Westinghouse Motor Company
5100 N IH 35 Round Rock, TX 78681
Evansbry@tecowestinghouse.com