Stall flow in the pump
Гидродинамика, Вибродиагностика, Резонанс
Every day we are used to facing the same problems on the pumps. Sometimes one glance at the vibration spectrum is enough to identify the problem and issue recommendations for its elimination. But sometimes the diagnostician is given the opportunity to work hard. In this article, we will consider a practical case of vibration diagnostics of vertical pumps, conduct a whole study and identify an incomprehensible spectral component.
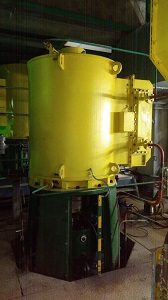
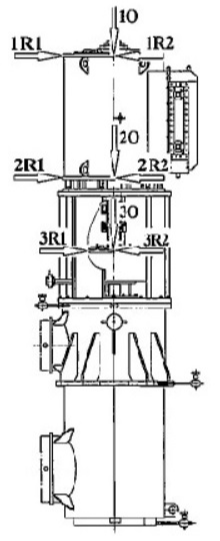
We have three new vertical pumps (let's call them No. 1, No. 2 and No. 3) with a capacity of 800 kW and a rotation speed of 1500 rpm. During commissioning, a deterioration in their vibration condition was found during operation under load. The task is to determine the cause of increased vibration and give recommendations for its elimination. No one will let the pumps start many times, so a work plan was drawn up, including measurements of vibration velocity and vibration acceleration (both pump and pressure pipeline), time signals (including freewheel), vibration phases of electric motors.
To begin with, let's measure the RMS vibration velocity of all pumps in two modes - underload (pressure at head around 1.0 MPa) and at full load (pressure at head up to 0.9 MPa). At the same time, we successively perform transitions on the pumps - we turn off one, turn on the other.
RMS vibration speed of pump unit No. 1 at Pн = 1.05 MPa:
RMS vibration speed of pump unit No. 1 at Pн = 0.88 MPa:
RMS vibration speed of pump unit No. 2 at Pн = 1.01 MPa:
RMS vibration speed of pump unit No. 2 at Pн = 0.87 MPa:
RMS vibration speed of pump unit No. 3 at Pн = 1.02 MPa:
RMS vibration speed of pump unit No. 3 at Pн = 0.87 MPa:
In accordance with the documentation, the tolerance for the electric motor (supports 1 and 2) is 4.5 mm / s. As you can see, at full pump load, the vibration of the electric motors exceeds the vibration requirements. Pump No. 3, which has very high vibration, stands out in particular.
What can be said about the general levels of vibration velocity? When the pumps are loaded, vibration in the direction of R2 increases very strongly, in the direction of R1 it remains at acceptable levels. Resonance.
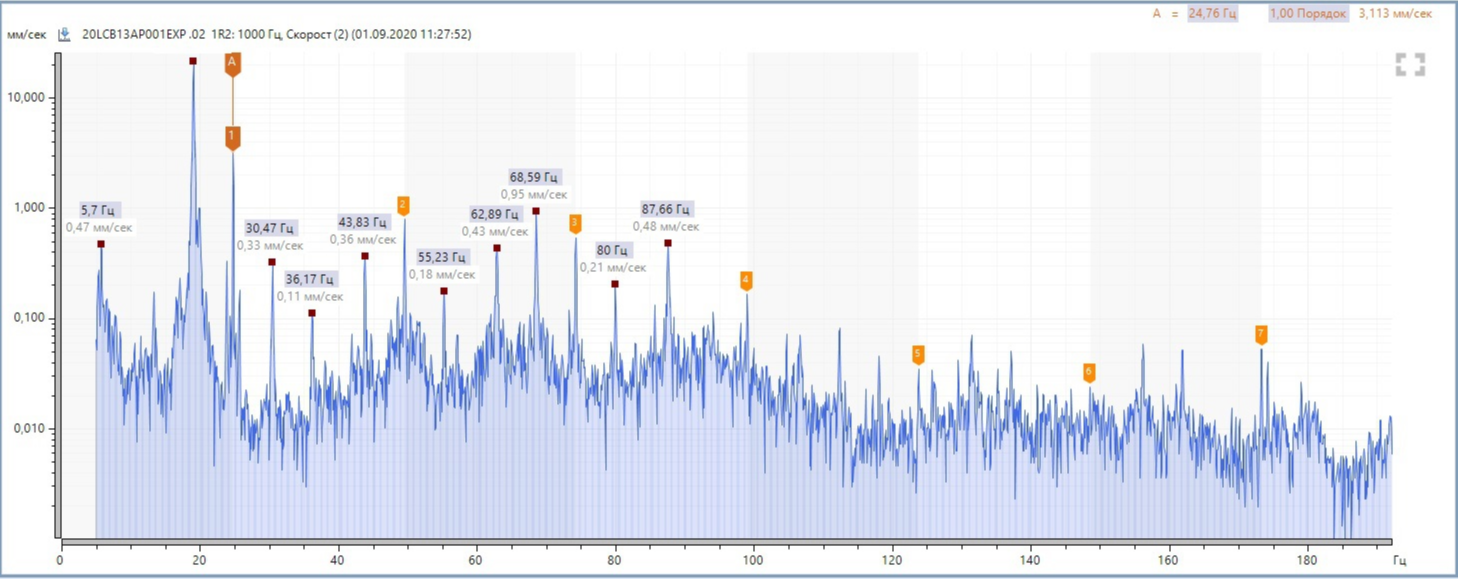
Let's take a look at the vibration velocity spectra.
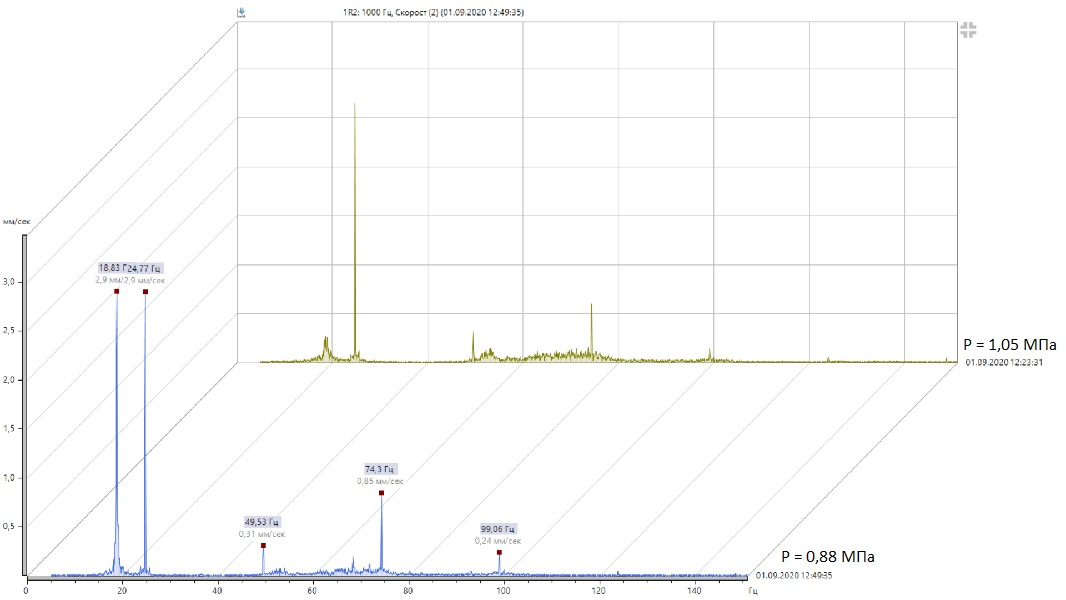
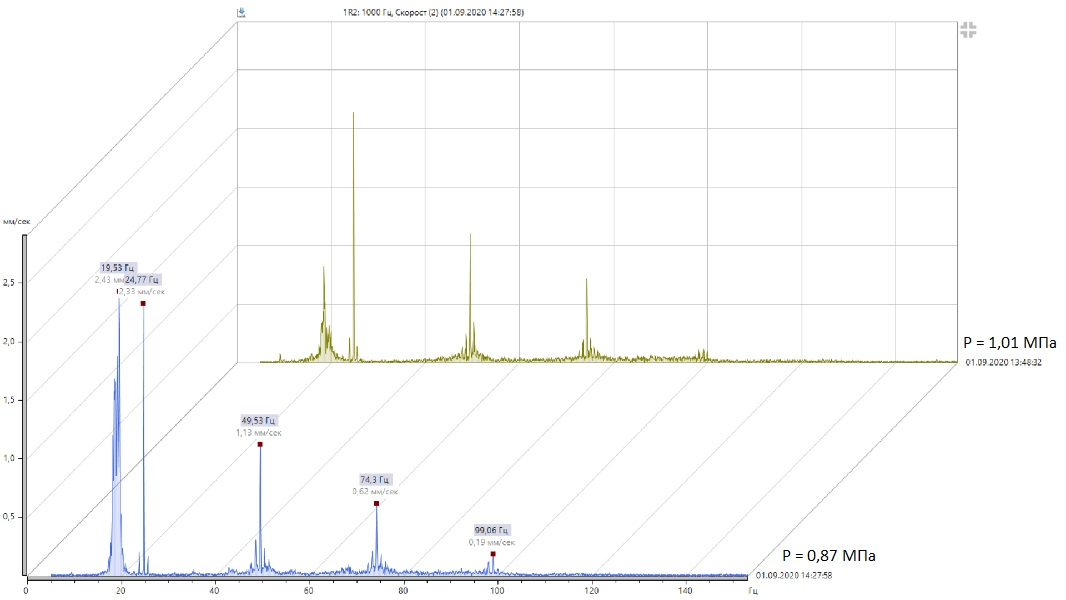
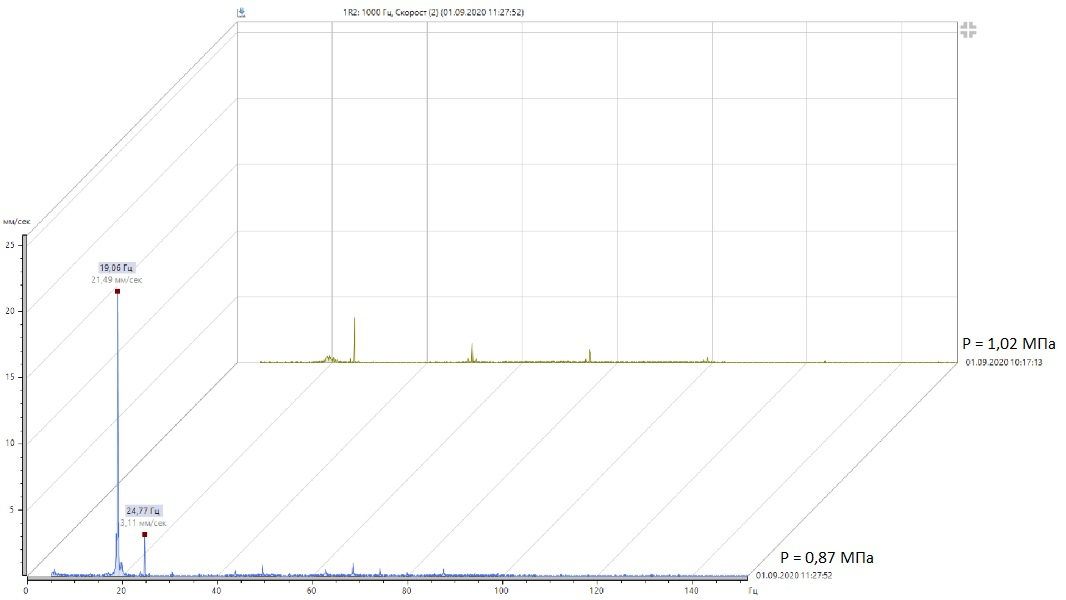
From the spectra, we see that when the pumps are loaded, the main contribution to vibration is made by frequencies around 19 Hz. Since the presence of resonance is assumed, it must be confirmed, and at the same time the natural frequency of the unit structure is found to the right or left of 19 Hz. It was not possible to determine the natural frequency with a shock test - one of the pumps must always remain in operation, and they have a common pressure manifold. Induced vibration in the discharge line will prevent this procedure from being performed. Measuring the frequency response at freewheel is also impossible - there are no reflective marks for the laser tachometer. Therefore, we use the recording of a temporary signal when the pump is turned off. In the SPM Leonova Diamond, this feature operates at 2560 samples per second, which is more than enough.
We record a time signal at point 1R2 for pumps No. 1 and No. 3 when they are turned off (for pump No. 2, measurements were not carried out).
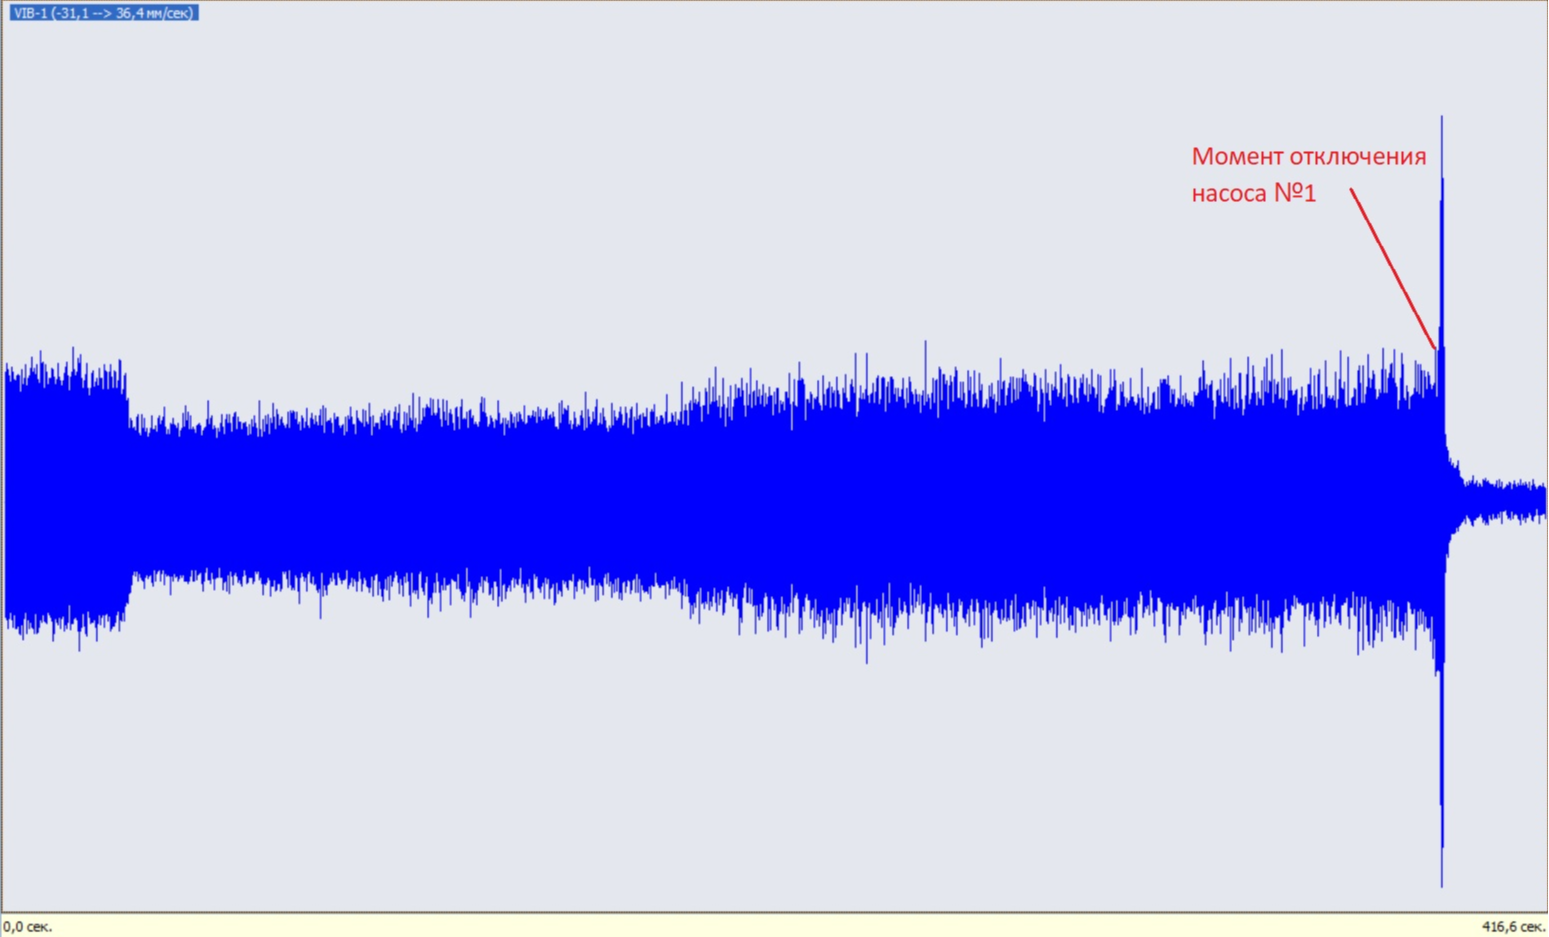
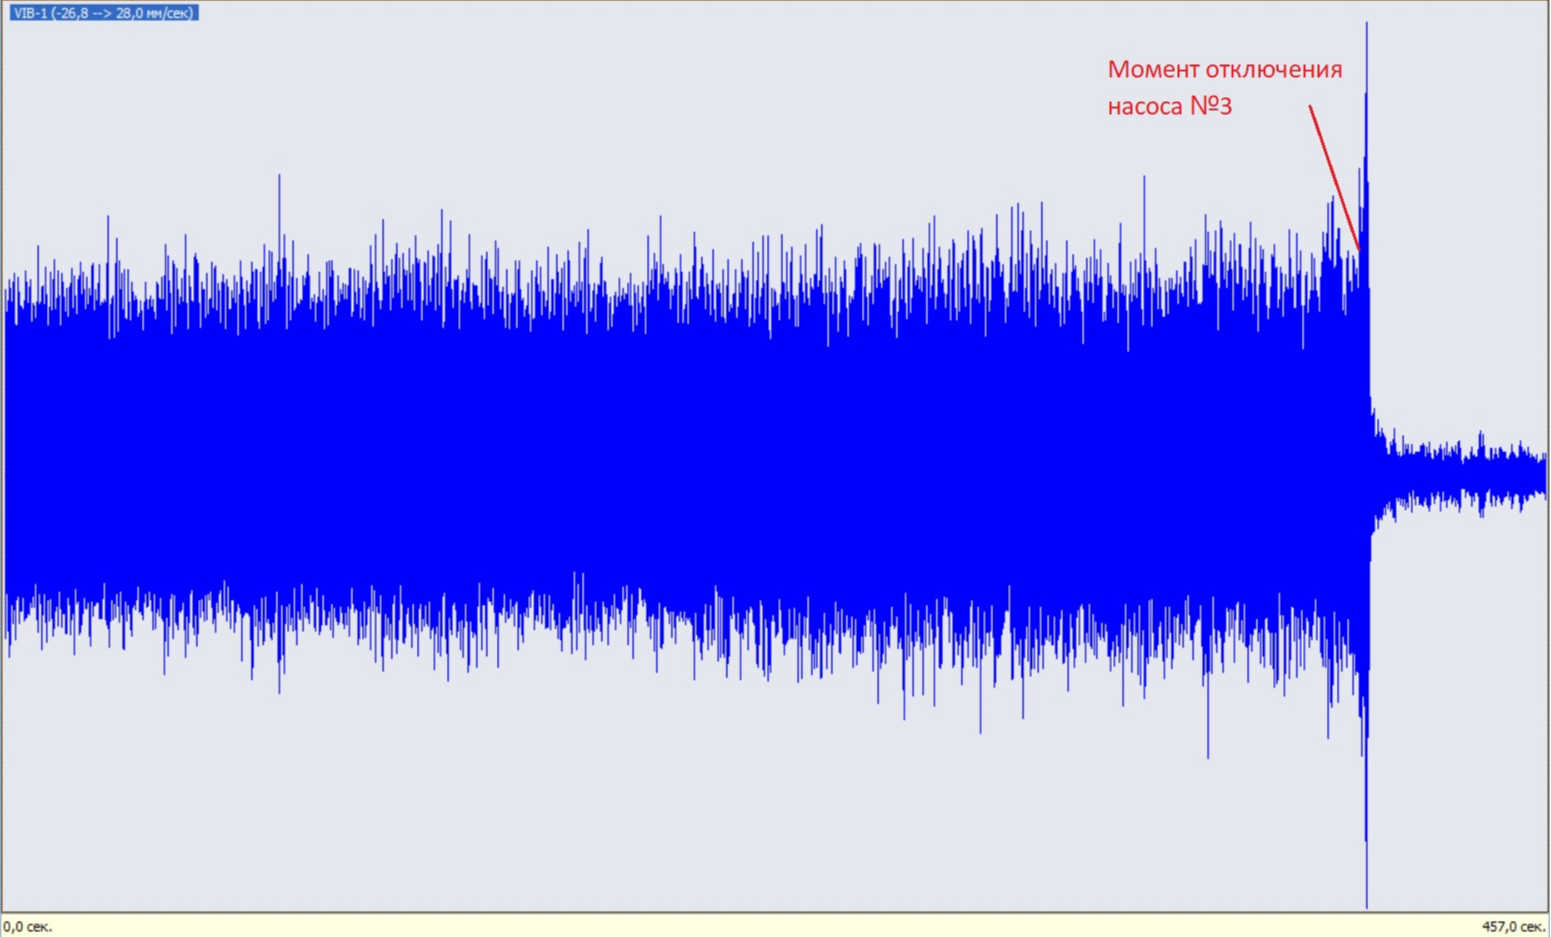
When disconnected on freewheel, a sharp jump in vibration is visible. The resonance is confirmed. The natural frequency of the unit design is lower than the revolving one.
It is impossible to determine the natural frequency from the time signal. Therefore, we will unload the data of the time signal for pump No. 3 from the software and in Matlab we will build a spectrogram (change in spectra over time).
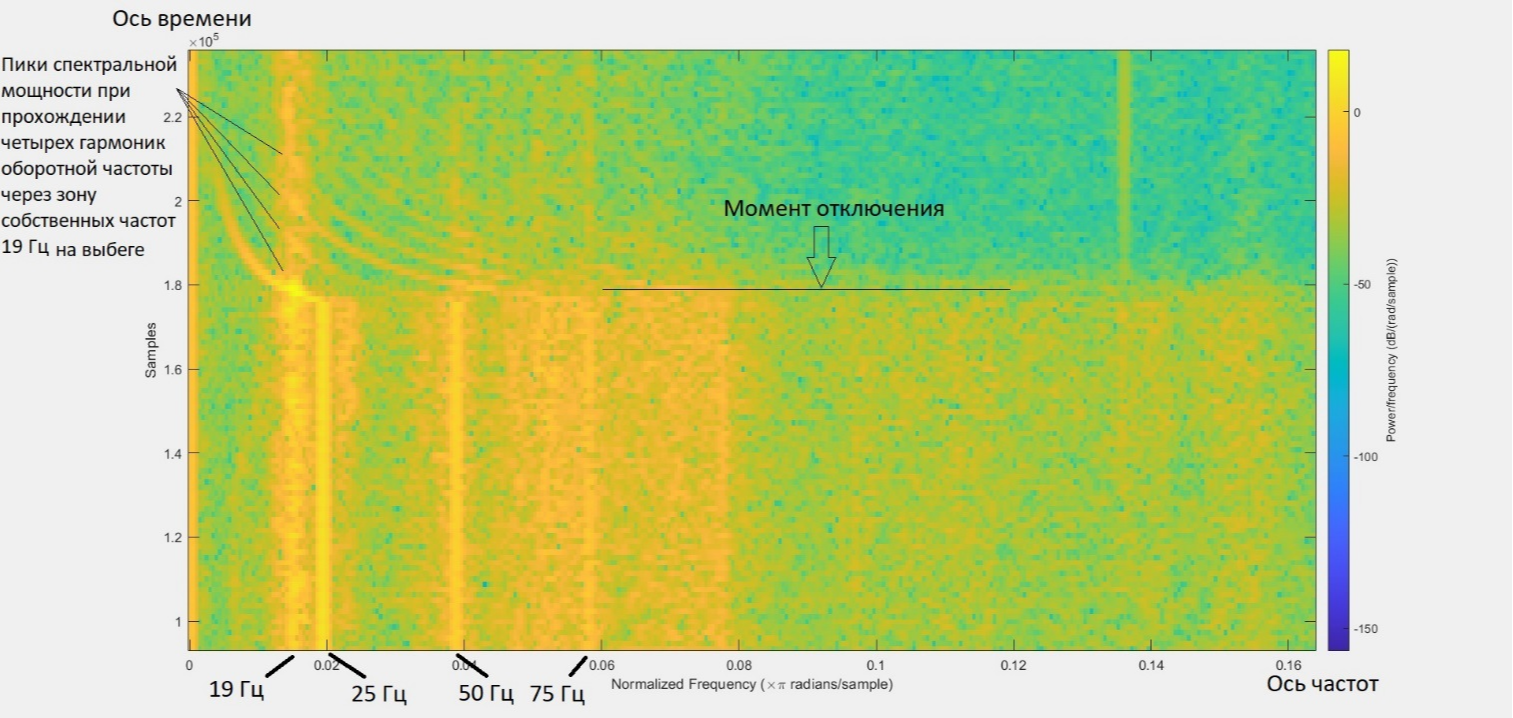
The spectrogram clearly shows that after the pump is switched off on freewheel, the maximum peaks of the spectral power of the harmonics of the revolving frequency fall on the 19 Hz region. In this case, the 19 Hz component itself loses its power, but does not change in frequency following the reverse one. This indicates that the resonance phenomenon passes and the unit continues to vibrate at its own frequency.
More interesting is the spectrogram of the time signal on the freewheel of pump No. 1 (transition from pump No. 1 to pump No. 2). The attentive reader must have noticed some kind of vibration drop at the beginning of the measurement at the freewheel of pump No. 1. And if the time signal does not allow us to determine at what frequency the change occurred, then the spectrogram will help us. Additionally, according to the pressure data, we will determine what happened at that time.
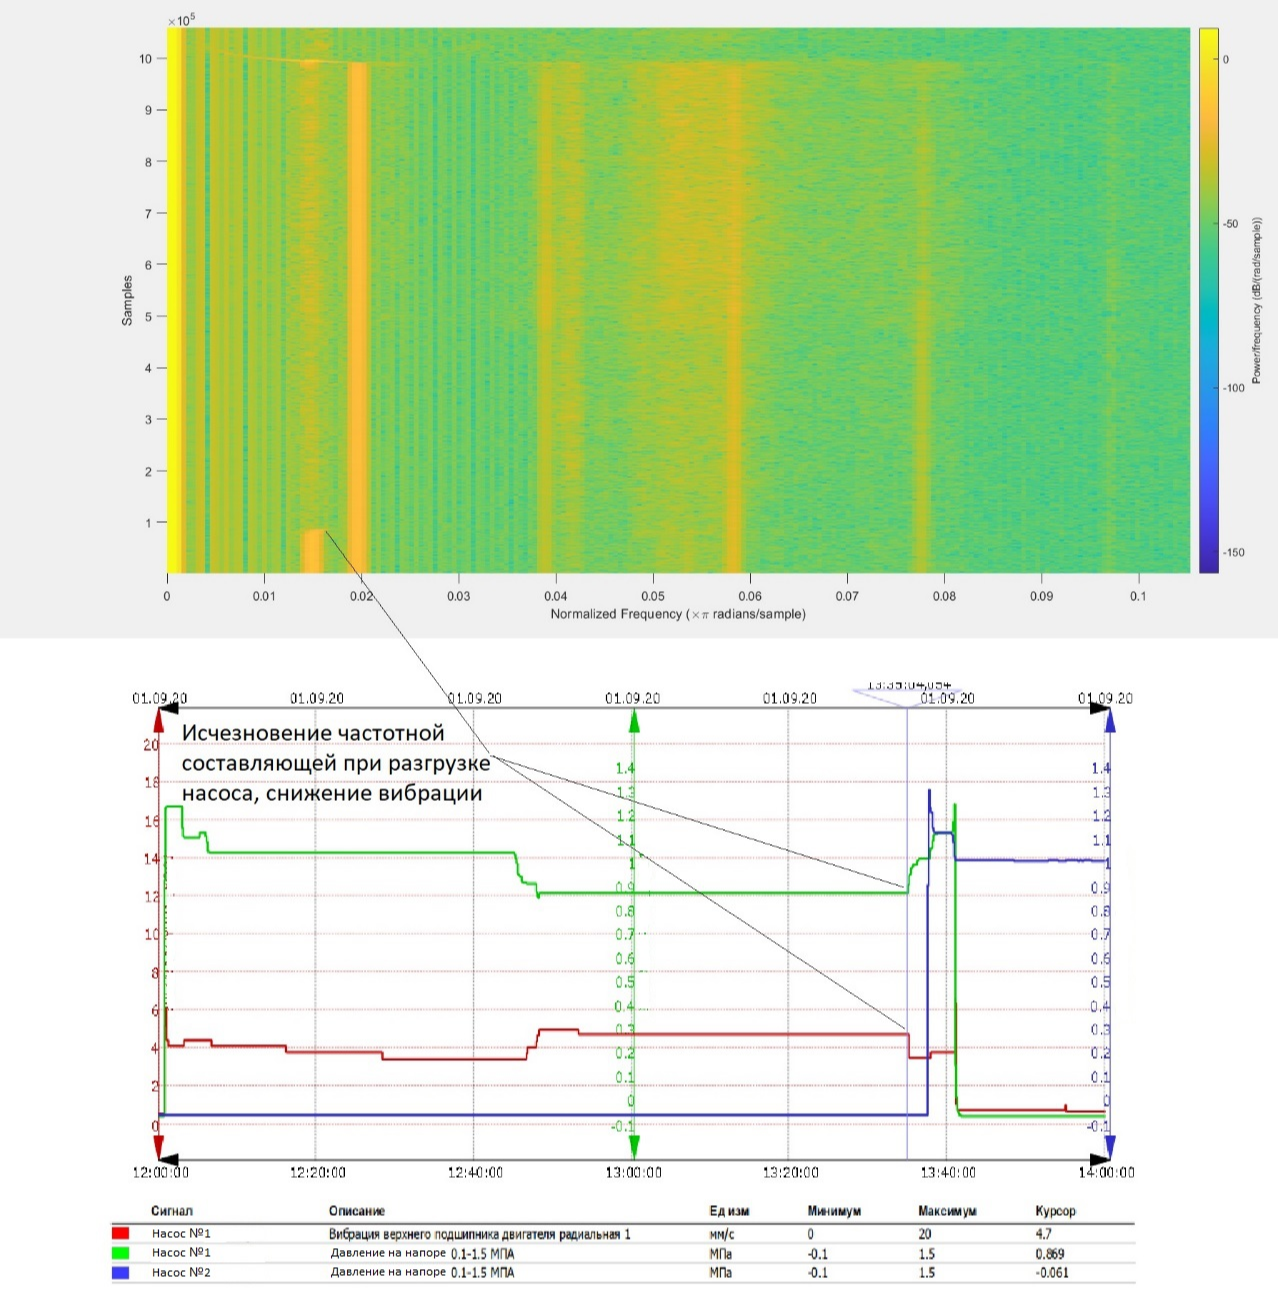
Before switching to pump No. 2, the operator unloaded pump # 1 (he started to close the discharge valve). At this moment, there was a sharp drop in vibration at the frequency of interest to us in the region of 19 Hz. That is, the vibration is greatly influenced by the operating mode of the pump.
In fact, there are two variants of the origin of the oscillations forcing resonance. This is either vibration of pressure pipelines (which depends on the flow of the medium), or vibration in the working chamber of the pump (hydrodynamic phenomena).
I carried out measurements of the vibration of the pipelines synchronously with the measurement of the vibration of the pump electric motor in the directions R1 and R2. We are more interested in the R2 direction, so let's compare the spectral and temporal signals.
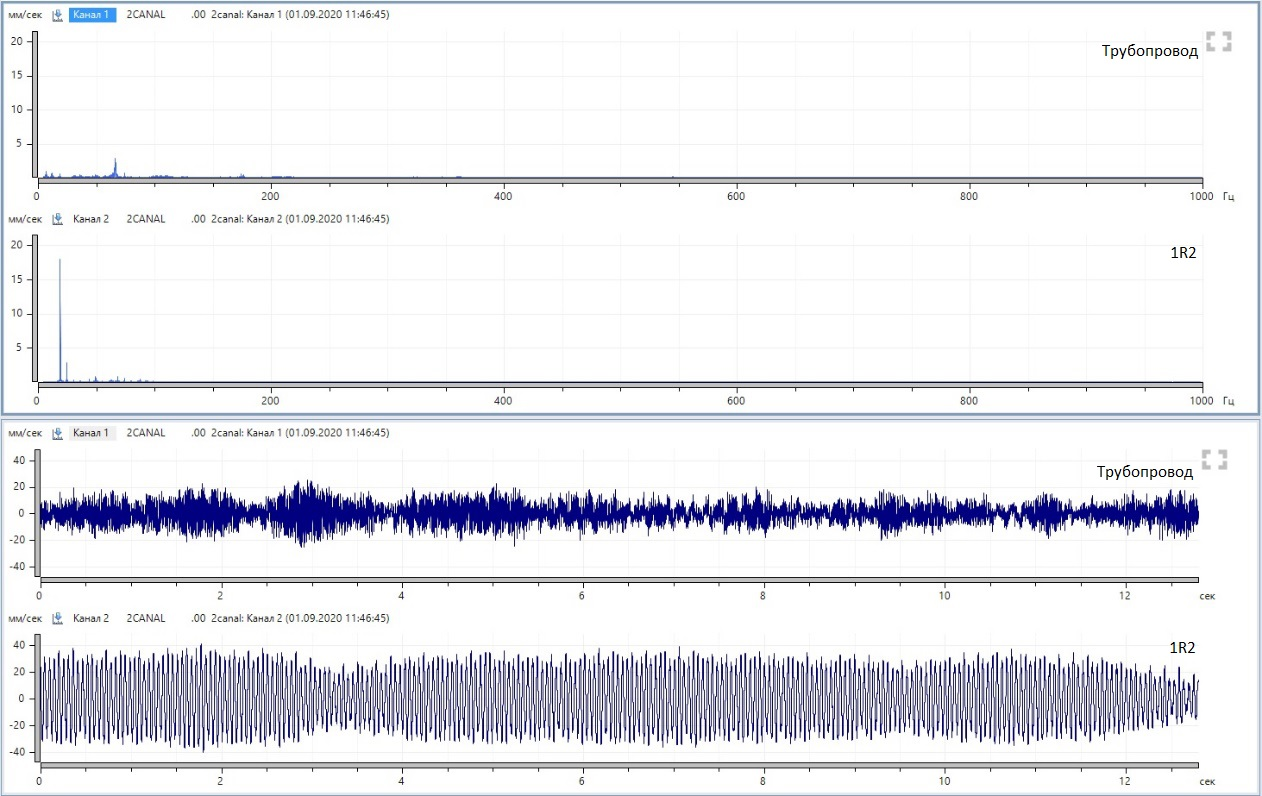
There is no mutual influence. The pipes vibrate at other frequencies. Moreover, unstable bursts in the time signal of the pressure pipe do not in any way affect the time signal of the pump motor vibration.
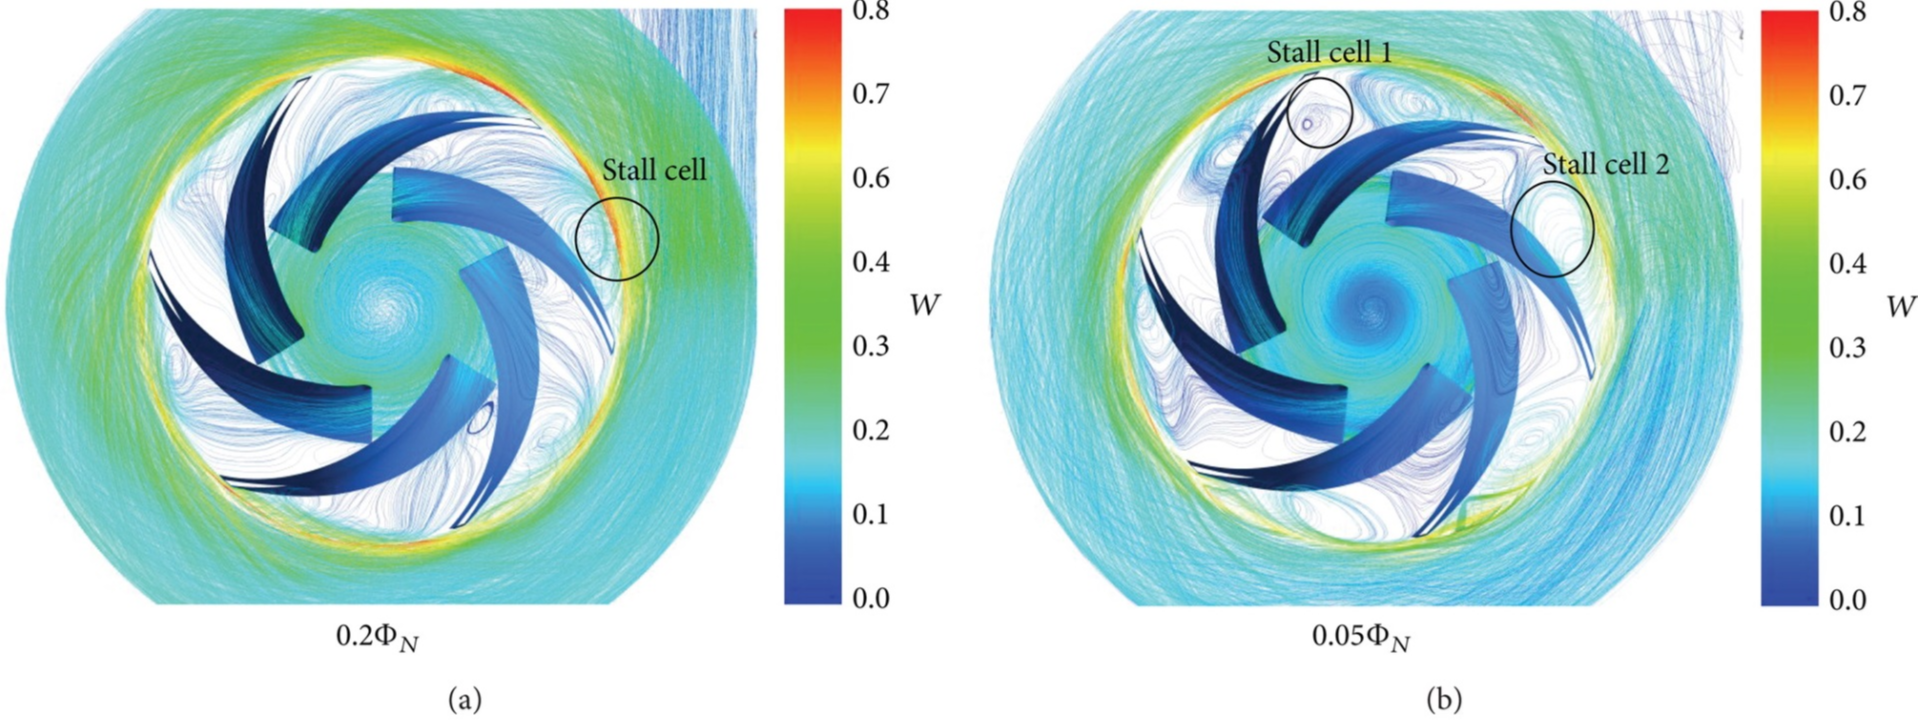
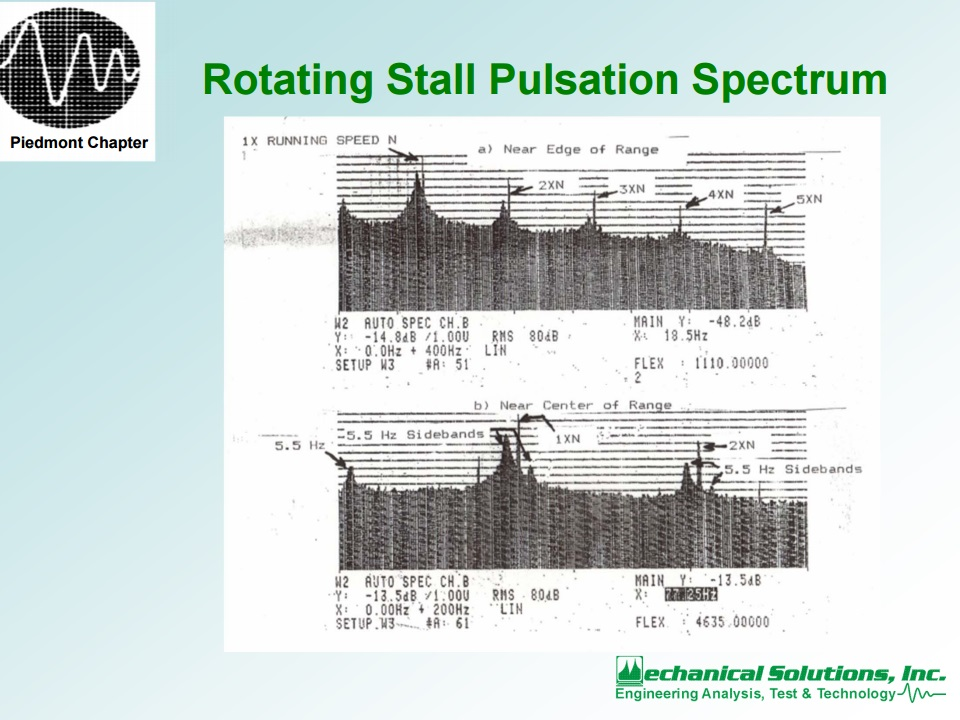
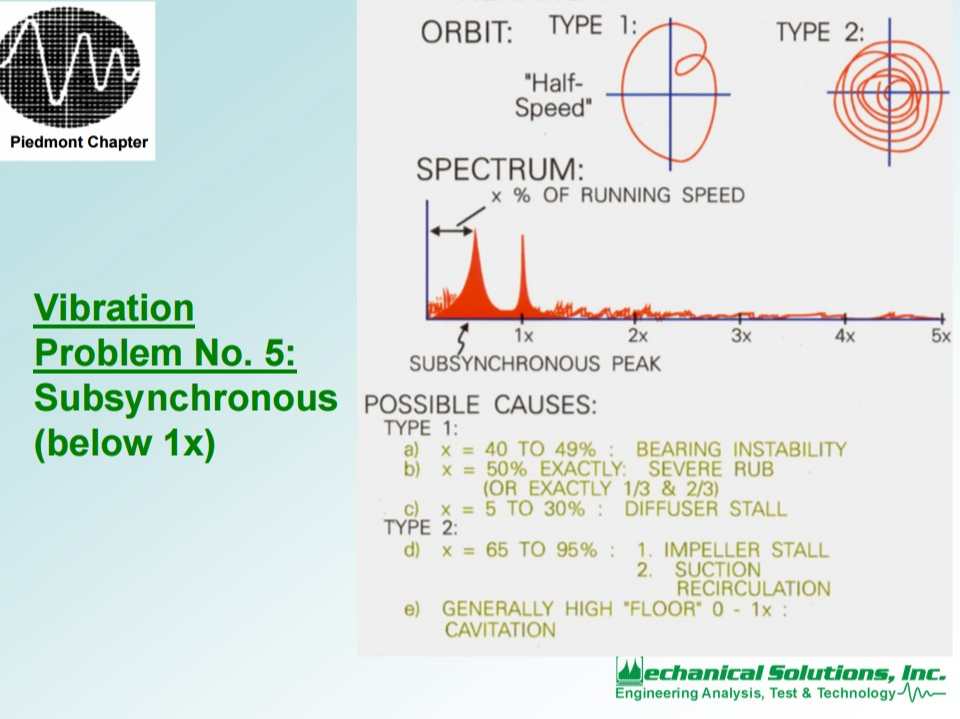
Hydrodynamics remains in the pump. A search on the Internet for the frequency composition of vibration for various defects made it possible to identify the defect. In the Western literature, among the frequency features characteristic of pump defects, the desired one was found - 0.8xRPM. Stalling of the flow (impeller stall, rotating stall pulsation) is characterized by a poor entry of the flow onto the impeller blade, due to which, instead of a smooth flow around the blade, the flow swirls and tends to the adjacent blade slightly blocking the inter-blade channel. Under the action of centrifugal forces, the vortex enters the gap between the impeller and the housing, which creates a rotating pulsating field. The very existence of flow stall and the frequency of its oscillations depends on the angle of attack of the blade, its length, flow velocity, distance between the blades and the rotor speed. As I understand it, there is no clear formula for calculating, there are only empirical dependences obtained experimentally.
Now let's move on to comparing the vibration signs of this defect and our data. As previously stated, the main feature of stall (rotating stall) is 0.8xRPM. In fact, not always, different studies report different data. Most often, the range from 0.6 to 0.9 of the impeller speed is distinguished.
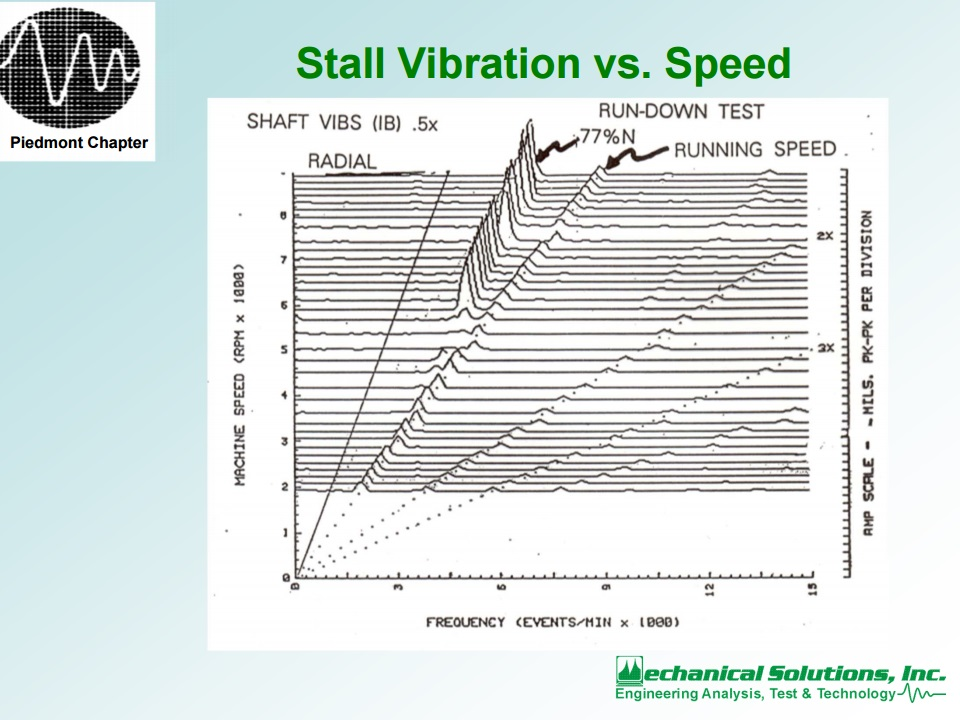
Let's take our revolving 24.77 Hz and multiply by 0.77 we get 19.07 Hz. Coincidence? Maybe. Moving on. In most studies, several harmonics of the turnover frequency were found with lateral plus / minus low-frequency components, which most likely modulate the harmonics of the turnover.
Let's compare with the spectrum on the pump No. 3, also reduced to the logarithmic scale.
Complete identity. Such a problem should lead to instability of the rotor position from revolution to revolution.
Let us compare it with the round-chart of the time signal at point 1R2 of pump No. 3.
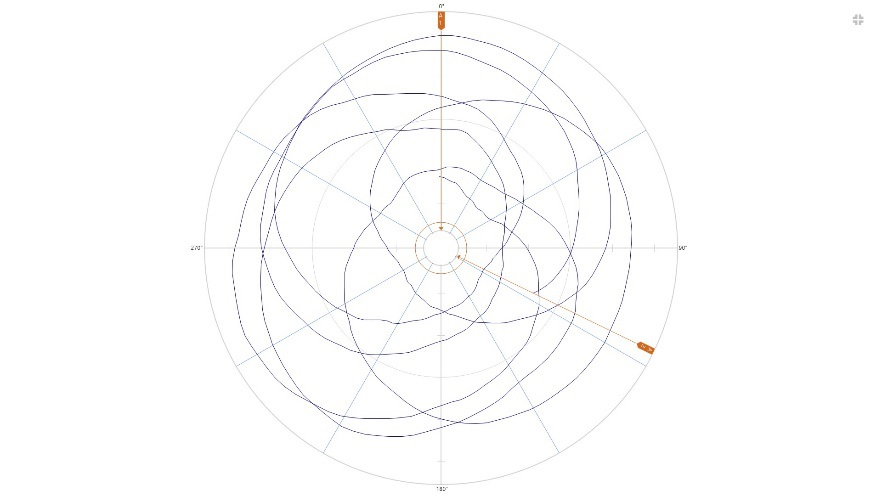
With a pump load and high vibration on the electric motor, it was impossible to determine the vibration phase, since it changed randomly from measurement to measurement, which also indicates a chaotic rolling of the rotor in the bearings.
The reason for the vibrations forcing resonance has been established. Since it is not possible to eliminate flow stall at full pump load, it is necessary to adjust the natural frequencies of the unit design from 19 Hz, which was indicated in the pump vibration control protocol.
Additionally, technologists need to pay attention to the mode at full load of the pump. Judging by the passport characteristics at pressures up to 0.9 MPa, the operating mode of the pumps falls out of the working range and it looks like the units are overloaded. These thoughts were also brought to the representative of the shop-owner of the equipment.
Update:
The technologists of the pump shop owner admitted a mistake - the pumps were overloaded. Corrective measures will be taken to prevent the pumps from operating outside the operating range.
По моему опыту, появление в спектре вертикальных насосов частоты 70-80% оборотной, указывает на увеличенные зазоры в уплотнениях рабочего колеса. Это типа автоколебаний ротора, вызванного взаимодействием рабочих и направляющих лопаток, плюс собственный резонанс ротора (критика) находящийся выше оборотной. И чем больше "разбито" уплотнение, тем выше уровень этой частототной линии. Похожую картину наблюдал и на мощном горизонтальном секционном насосе, но там кроме "разбитых" уплотнений был ещё и "излом" корпуса по центру. "Низкочастотная" вибрация возникает практически "скачком" при достижении какой то, определённой нагрузки насоса и также "скачком" без гестерезиса пропадает при снижении нагрузки.
Непонятно только почему такая картина на новых насосах. Либо заводской брак, либо насосы часто работают в режиме кавитации (в том числе с нагрузкой больше паспортной) и из-за этого относительно быстро разбило уплотнения.